Possible Duplicate:
How can I influence the spaces between labels on a BarChart
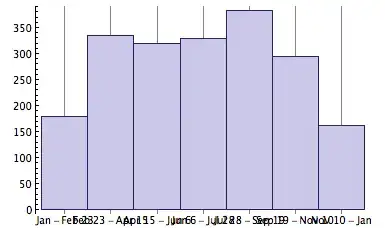
How can I avoid label collisions in plot ticks and labels? For example, here is a histogram with colliding frame tick labels:
BarChart[{Labeled[{196}, Row[{"Jan", "Feb 23"}, "-"], Below],
  Labeled[{349}, Row[{"Feb 23", "Apr 15"}, "-"], Below],
  Labeled[{333}, Row[{"Apr 15", "Jun 6"}, "-"], Below],
  Labeled[{308}, Row[{"Jun 6", "Jul 28"}, "-"], Below],
  Labeled[{308}, Row[{"Jul 28", "Sep 19"}, "-"], Below],
  Labeled[{344}, Row[{"Sep 19", "Nov 10"}, "-"], Below],
  Labeled[{162}, Row[{"Nov 10", "Jan"}, "-"], Below]},
 GridLines -> {Automatic, None},
 BaseStyle -> Directive[FontFamily -> "Bitstream Charter", 10],
 BarSpacing -> 0, Ticks -> None, GridLines -> None,
 Frame -> {{True, False}, {False, False}}, PlotRange -> All,
 BarOrigin -> Bottom, BarSpacing -> None, ChartLayout -> "Stacked",
 PerformanceGoal -> "Speed",
 ChartStyle -> {Directive[
    EdgeForm[{Opacity[1.`], Thickness[Medium], Blue}], Opacity[1.`],
    FaceForm[LightBlue]]}]
So the question has two parts:
- How to detect collisions in frame tick labels in general.
- How to rearrange labels to minimize collisions and optimize for aesthetics.
I'm not sure how to do part 1, but part 2 should involve either rotations or columns I guess. I would rather not assume a specific font or size of text, but perhaps this is unavoidable.
