I want to chart data using a BarChart, the labels on the x-axis are numbers. Unfortunately they are so close to each other it really looks strange and more like one huge number. How can I add a spacing between the labels?
The relevant piece of code:
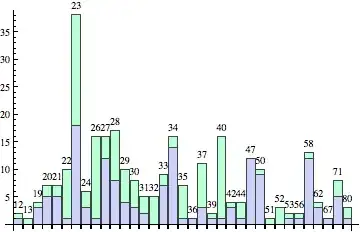
datalist = {{12, 1, 1}, {13, 0, 1}, {19, 3, 1}, {20, 5, 2}, {21, 5, 2},
{22, 1, 9}, {23, 18, 20}, {24, 3, 3}, {26, 1, 15}, {27, 12, 4}, {28, 8, 9},
{29, 4, 6}, {30, 3, 5}, {31, 2, 3}, {32, 0, 5}, {33, 7, 2}, {34, 14, 2},
{35, 1, 6}, {36, 1, 0}, {37, 3, 8}, {39, 1, 1}, {40, 1, 15}, {42, 3, 1},
{44, 1, 3}, {47, 12, 0}, {50, 9, 1}, {51, 0, 1}, {52, 0, 3}, {53, 1, 1},
{56, 1, 1}, {58, 12, 1}, {62, 3, 1}, {67, 1, 0}, {71, 5, 3}, {80, 1, 2}};

BarChart[datalist[[All, {2, 3}]], ChartLayout -> "Stacked",
    ChartLabels -> { Transpose[datalist][[1]], None}]


Column["", label], +1. – rcollyer Apr 18 '12 at 14:4290 Degree. – rcollyer Apr 18 '12 at 15:20