Would someone mind showing me how to plot a floor function with the appropriate endpoints? I tried Google, but the best I could find was something posted from 2004 that no longer appears to work.
Sorry if this is overly basic, I've only got a couple of weeks of experience with Mathematica and no one to work with on it.
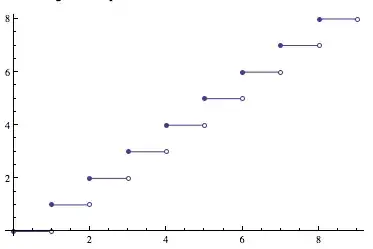
Edit: I'm looking to create a graph similar to the one shown on the wiki page for floor/ceiling functions. I'm not too concerned with the frame or the tick marks.
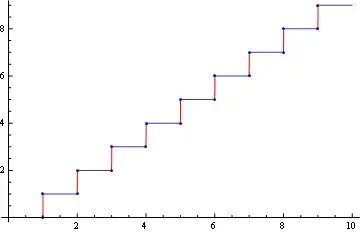
Exclusions -> Noneto your plot command. Also, the documentation covers this very example – rm -rf Sep 26 '12 at 00:40