I wanted to plot a function involving Floor, here is my code:
epsilon = 0.1;
f[t_] = Floor[t/epsilon];
Plot[{f[t]}, {t, 0, 5}]
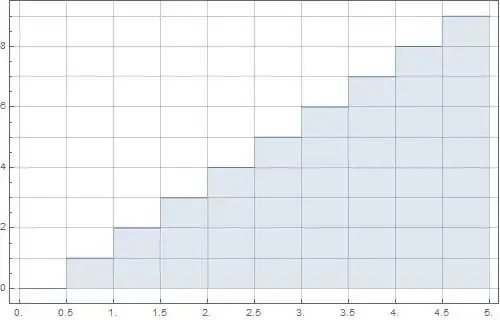
it gives me the following, which has smaller bars as t increases:

I know that I can plot Floor with DiscretePlot, as suggested here, but I would like to understand, why Plot cannot handle it correctly. Thanks!