0

I need some help on plotting the curve generated by a vector, given its three components as a function of two parameters, e.g. s1 and s2, whose range are known, and they have to satisfy a given constraint equation. Below is a simple example:

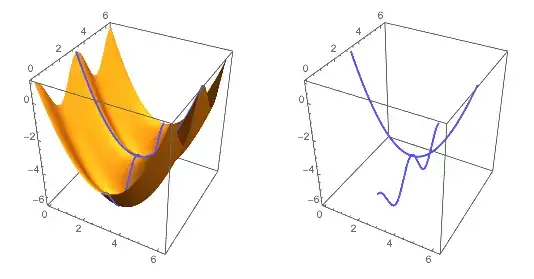
I can plot a surface of such a vector e.g. : ParametricPlot3D[{s1, s2, s1}, {s1, 0, 2 Pi}, {s2, 0, 2 Pi}], which gives a plane. Now I need to add a constraint, e.g. Cos[s1] + Cos[s2] + Cos[s1] Cos[s2] = -1. Then I expect the desired figure to be a curve. But I wonder how to plot this curve? Should I use the ParametricPlot3D function or what else? and how?

Please note that the above is just a simple example, and in my case, I may not be able solve for the constraint equation.

Thanks for any suggestions!

Update II:

Finally I notice that the answer by Michael is probably right, the inconsistence is due to my formulation error, so I have deleted that part. Thanks a lot for all the help!

larry
  • 725
  • 3
  • 11
  • Related: http://mathematica.stackexchange.com/questions/5968/plotting-implicitly-defined-space-curves – Szabolcs Apr 21 '16 at 15:41

1 Answers1

5

One way is to use MeshFunctions to plot F[..] = 0:

MeshFunctions -> {Function[{x, y, z, s1, s2},
   Cos[s1] + Cos[s2] + Cos[s1] Cos[s2] + 1]},
Mesh -> {{0}}, MeshStyle -> {Directive[Thick, Lighter@Blue]}

The function F is the mesh function

Function[{x, y, z, s1, s2}, Cos[s1] + Cos[s2] + Cos[s1] Cos[s2] + 1]

where the equation F[..] == 0 is specified by the option Mesh -> {{0}}.

Here is a look at the solution, with a more complicated surface:

GraphicsRow[{
  (* the curve + surface *)
  ParametricPlot3D[{s1, s2, s1^2/2 - Pi s1 + Cos[2 s2]}, {s1, 0, 
    2 Pi}, {s2, 0, 2 Pi},
   MeshFunctions -> {Function[{x, y, z, s1, s2}, 
      Cos[s1] + Cos[s2] + Cos[s1] Cos[s2] + 1]},
   Mesh -> {{0}}, MeshStyle -> {Directive[Thick, Lighter@Blue]}],

  (* the curve *)
  ParametricPlot3D[{s1, s2, s1^2/2 - Pi s1 + Cos[2 s2]}, {s1, 0, 
    2 Pi}, {s2, 0, 2 Pi},
   MeshFunctions -> {Function[{x, y, z, s1, s2},
      Cos[s1] + Cos[s2] + Cos[s1] Cos[s2] + 1]},
   Mesh -> {{0}}, MeshStyle -> {Directive[Thick, Lighter@Blue]},
   PlotStyle -> None]
  }]

Mathematica graphics

Michael E2
  • 235,386
  • 17
  • 334
  • 747
  • HI Michael, thanks a lot, this is very helpful! it solves my problem, but I have a related question: I can plot the curve as you described, but I wonder if I can map this curve to a curve on a unit sphere, i.e., for any vector on the previous curve, the intersection of this direction and the unit sphere will form a point, and all such points on the sphere will form another curve. I wonder if this is possible? The reason I ask this is because the final curve I need is on the unit sphere. Thanks again! – larry Apr 21 '16 at 01:27