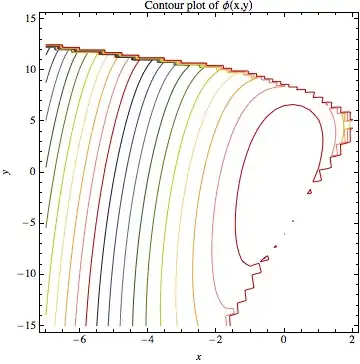
I am interested in improving this plot:
which I produced with the following command:
dat // ListContourPlot[#, ContourShading -> False,
   ContourStyle -> ColorData[10] /@ Range[10], Contours -> Range[21]/8,
   ContourLabels -> None, FrameLabel -> {x, y},
   DataRange -> {{-7, 2}, {-15, 15}}, PlotLabel -> "Contour plot of ϕ(x,y)"] &
The actual dat is available here; the edge corresponds to zero values (though, it could be set to something else).
Question
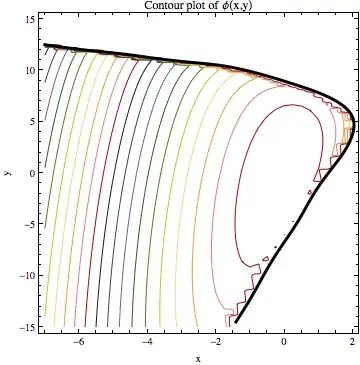
I would like Mathematica to identify the edge of the contours and do a region plot to avoid the ragged line, or alternatively, to draw a thick line over it to make it publication-friendly.
Attempt
I guess I know how to find the edge:
dat2 = dat // Image // EdgeDetect // ImageData // Position[#, 1] & // Sort;
On the other hand, these points are not sorted correctly:

I supposed I could use 2D neighbours as a criterion for sorting, but I feel there is a smarter way to achieve my overall goal(?)


FindCurvePath[], I presume? – J. M.'s missing motivation Oct 01 '12 at 13:41