I have some data that I am plotting with ListContourPlot and I would like my contours to be closed at the edge (closing around the high value region).
A simple example:
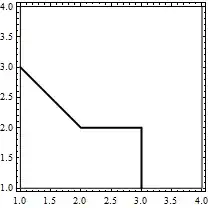
ListContourPlot[{{3, 2, 1, 0}, {2, 1, 1, 0}, {1, 0, 0, 0}, {0, 0, 0, 0}},
                 Contours -> {1}, ContourShading -> None, ContourStyle -> Thick]
](../../images/80b53a58854007b3762970faec394c80.webp)
I know you can add e.g. BoundaryStyle -> Black, but it closes the whole region:
Note that I have tried the answer here, but that method changes the plotting method from plotting a matrix to plotting {x,y,f(x,y)} values, which has some undesirable results on my (much more complicated than the above example) data.

ListContourPlot[{{3, 2, 1, 0}, {2, 1, 1, 0}, {1, 0, 0, 0}, {0, 0, 0, 0}}, Contours -> {1}, ContourShading -> None] /. Line[x_] :> Line[Join[{{1, 1}}, x, {{1, 1}}]]? – Kuba Mar 21 '14 at 20:24