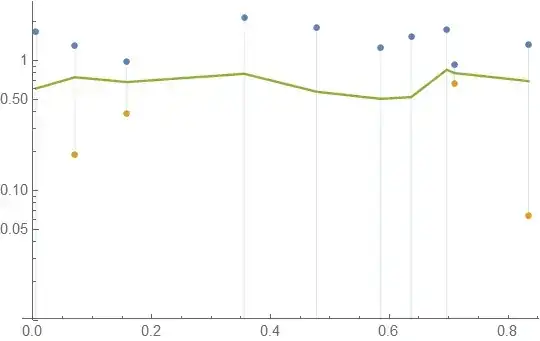
Non-positive numbers are not real, so they cannot be plotted on the log scale. If these numbers are actually non-physical, like negative absolute temperatures or expected life, you might reconsider how the error limits are being computed. If they are physical, but uninteresting, you could replace them with positive numbers smaller than the smallest interesting values, and then restrict the range of the plot to let them truncate. This might serve the purpose of displaying the data.
In the code below, the code by @Dr. Belisarius has been modified to accomplish this:
dataX=Sort@RandomReal[1,10];
dataY=RandomReal[{0.5,1},10];
error=RandomReal[1.5,10];
f[y_]:=Transpose[{dataX,y}];
plusMinus[a_,b_]:={a+b,a-b,a};
plusMinListRaw=Thread[plusMinus[dataY,error]];
(* smaller than smallest interesting value *)
minVal=0.001;
(* replace non-positive numbers with minVal *)
plusMinList={#[[1]],If[#[[2]]<=0,minVal,#[[2]]],#[[3]]}&/@plusMinListRaw;
(* restrict lower range using opts *)
ePlot[plotFun_,dataX_,plusMinList_,opts___]:=plotFun[{f[plusMinList[[All,1]]],f[plusMinList[[All,2]]],f[plusMinList[[All,3]]]},Filling->{1->{2}},Joined->{False,False,True},opts]
ePlot[ListLogPlot,dataX,plusMinList,PlotRange->{Automatic,{10 minVal,All}}]