5

How do i use accounting form as default for ticks in graph?

I am using

$PrePrint=AccountingForm;

but this is not affecting the ticks in graph.

Michael this following is still causing problems.

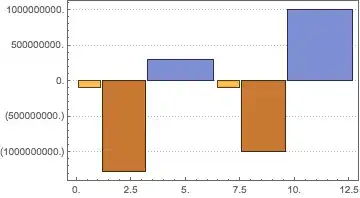
RectangleChart[{{{1, 275223.704333`}, {1, 647056.333196`}, {1, 
    595454.512134`}, {1, 588530.099239`}}, {{1, 839132.567778`}, {1, 
    968881.133341`}, {1, 1.225078442665`*^6}, {1, 
    1.148257714327`*^6}}}, BarSpacing -> {0, 1}, 
 ChartLabels -> {Placed[{"New", "Renew"}, {0.5, 0.5}], {1, 2, 3, 4}}, 
 ChartStyle -> (Directive[#, Opacity[0.75]] & /@ 
    ColorData[97, "ColorList"]), ImageSize -> Large, Axes -> True, 
 PlotTheme -> "Detailed", 
 FrameTicks -> {{acctTicks, None}, {None, None}}, PlotRange -> All]
user13892
  • 9,375
  • 1
  • 13
  • 41
  • try something like 
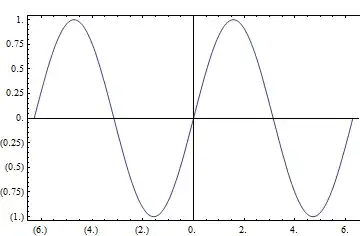
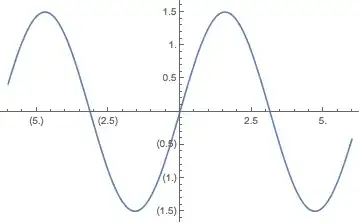
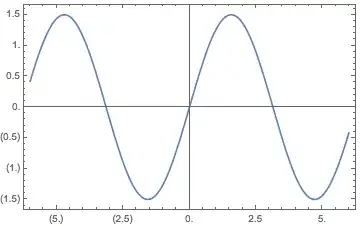
Plot[Sin[x], {x, -2 Pi, 2 Pi}, Ticks -> {{#, AccountingForm[N@#, 3]} & /@ Range[-2 Pi, 2 Pi, Pi/2], {#, AccountingForm[#]} & /@ {-1, -.5, .5, 1}}] – kglr May 21 '17 at 17:36
  • But i am writing a general code which has to work with plots of any range. Thus would like to not specify the ticks explicitly. – user13892 May 21 '17 at 17:49
  • 1
    Ask WRI for this feature as the more that ask the more likely it will be added. I wanted to do this a while ago and made a suggestion to WRI to add an option for axis and one for frame to both Graphics and Graphics3D (that most other plots would inherit) that takes a function to format each axis/frame. For example the option would have taken ConstantArray[AccountingForm[#, {3,2}]&, 2] to reformat both axis of Plot. – Edmund May 21 '17 at 21:39

2 Answers2

3

You can define a function to post-process the plot outputs to modify the labels for Ticks or FrameTicks:

postProcessF = Module[{o, frame = (Frame /. Options[#, Frame])}, 
  Module[{t = If[frame === False, o = Ticks, o = FrameTicks] /. Quiet[AbsoluteOptions@#]}, 
     t[[All, All, 2]] = t[[All, All, 2]] /. x_?NumericQ :> AccountingForm[x]; 
     Show[#, Frame -> frame, o -> t]]] &;

Examples:

postProcessF @ Plot[Sin[x], {x, -2 Pi, 2 Pi}]

Mathematica graphics

postProcessF @ Plot[Sin[x], {x, -2 Pi, 2 Pi}, Frame -> True]

Mathematica graphics

postProcessF @ Plot[Sin[x], {x, -2 Pi, 2 Pi}, Frame -> {{True, False}, {True, True}}]

Mathematica graphics

kglr
  • 394,356
  • 18
  • 477
  • 896
  • ... this does not handle the case where Frame -> {{False, False}, {False, False}}. – kglr May 21 '17 at 18:49
  • If you apply AbsoluteOptions[#,Ticks]& and AbsoluteOptions[#,FrameTicks]& on RectangularChart it doesn't return the ticks being used in the plot. So i don't know how to use the post-process method. Can you please make it work with RectangularChart. – user13892 May 25 '17 at 18:04
1

The methods in the Q&A, About the number format in ticks, could probably be adapted to this case.

Here's an approach, somewhat like Mr. Wizard's in the linked Q&A:

acctTicks = Charting`ScaledTicks[{Identity, Identity}][##] /.
  {{x_?NumericQ, Except[_Spacer], y__} :> {x, AccountingForm[x], y}} &;

Plot[1.5 Sin[x], {x, -6, 6}, Ticks -> {acctTicks, acctTicks}]

Mathematica graphics

Plot[1.5 Sin[x], {x, -6, 6},
 Frame -> True, 
 FrameTicks -> {{acctTicks, Automatic}, {acctTicks, Automatic}}]

Mathematica graphics

RectangleChart[
 {{{1, -10^8}, {2, -20^7}, {3, 3*10^8}}, {{1, -10^8}, {2, -10^9}, {3, 10^9}}}, 
 PlotTheme -> "Detailed", 
 FrameTicks -> {{acctTicks, None}, {acctTicks, None}}]

Mathematica graphics

Michael E2
  • 235,386
  • 17
  • 334
  • 747
  • how do i load this Charting\ScaledTicks` function is it available to download or included in mathematica. – user13892 May 22 '17 at 07:39
  • @user13892 It should already be included, unless you have a very old version. It's part of the support functions for Plot and can be found in answers on this site since 2012. Did it not work for you? – Michael E2 May 22 '17 at 10:32
  • Thank you, why it is not working in this code:

    RectangleChart[{{{1, -10^8}, {2, -20^7}, {3, 3*10^8}}, {{1, -10^8}, {2, -10^9}, {3, 10^9}}}, PlotTheme -> "Detailed", FrameTicks -> {{acctTicks, None}, {acctTicks, None}}]

    – user13892 May 22 '17 at 10:59
  • I believe i will have to change the function acctTicks to make it work with this but i don't understand how it works. – user13892 May 22 '17 at 11:58
  • Michael can you please write one that will work for RectangleChart[{{{1, -10^8}, {2, -20^7}, {3, 3*10^8}}, {{1, -10^8}, {2, -10^9}, {3, 10^9}}}, PlotTheme -> "Detailed", FrameTicks -> {{acctTicks, None}, {acctTicks, None}}]. I can't write it on my own. – user13892 May 22 '17 at 13:25
  • You can check your acctTicks does not work on this and must be modified. – user13892 May 22 '17 at 13:44
  • The Chart family functions do many things automatically that interfere with normal plotting options. Perhaps you'd prefer the look of this: `RectangleChart[{{{1, -10^8}, {2, -20^7}, {3, 310^8}}, {{1, -10^8}, {2, -10^9}, {3, 10^9}}}, ChartLabels -> {"a", "b", "c"}, Ticks -> {None, acctTicks}, Axes -> True, Frame -> False, PlotTheme -> "Detailed"]` --> http://i.stack.imgur.com/yEN2I.png – Michael E2 May 22 '17 at 13:47