Minor variation on @Mr Wizards answer:
using {{l,r},{b,t}} syntax for Frame just to be consistent with FrameTicks
using ColorFunction to alter the colour ordering
gives
BarChart[Reverse@Range[5],
 BarOrigin -> Left,
 ColorFunction -> ColorData["Rainbow"],
 Frame -> {{False, False}, {False, True}},
 FrameTicks -> {{None, None}, {None, All}}]

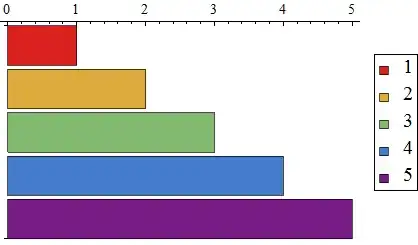
BarChart[Reverse@Range[5],
 BarOrigin -> Left,
 ColorFunction -> ColorData[{"Rainbow", "Reverse"}],
 Frame -> {{False, False}, {False, True}},
 FrameTicks -> {{None, None}, {None, All}}]

Note that you could have also used ColorFunction -> Function[{x},ColorData["Rainbow"][1-x]].
Now for the legends. Unfortunately the legends are based on ChartStyle so when you control the bar colours using ColorFunction the ChartLegends option doesn't work (in so far as no color swatches are produced).
This does not present a problem for this case -- which seems to be the specific example you are looking for:
BarChart[Reverse@Range[5],
 BarOrigin -> Left,
 ChartStyle -> "Rainbow",
 ColorFunction -> ColorData["Rainbow"],
 ChartLegends -> Map[ToString, Range[5]],
 Frame -> {{False, False}, {False, True}},
 FrameTicks -> {{None, None}, {None, All}}]

but for other variations this simple code doesn't produce ideal outcomes:
BarChart[Reverse@Range[5],
 BarOrigin -> Left,
 ChartStyle -> "Rainbow",
 ColorFunction -> ColorData[{"Rainbow", "Reverse"}],
 ChartLegends -> Map[ToString, Reverse@Range[5]],
 Frame -> {{False, False}, {False, True}},
 FrameTicks -> {{None, None}, {None, All}}]

It seems clear that the built in legend option should base its colour swatches on the actual colours used to render the bars (i.e. in this case controlled by ColorFunction). That it does not seems like an oversight. Most of us here don't like (understatement) the built in legends and legend options and tend to roll our own.
Edit -- making a simple legend for your bar chart
To reproduce the sort of legend generated with ChartLegends you can use MapIndexed
labels = Range[5];

Framed@Grid[
  MapIndexed[{Graphics[{ColorData[{"Rainbow", "Reverse"}][
        Rescale[First[#2], {1, Length[labels]}]], Rectangle[]},
      AspectRatio -> 1, ImageSize -> 15], #1} &, labels],
  Alignment -> {Center, Center}]

For the ColorData gradient to work you need to scale the argument. Within the BarChart ColorFunctionScaling by default is True so this happens automatically. But to get it to work here you have to do the scaling yourself -- which is what Rescale[First[#2], {1, Length[labels]}] is doing. You can add styling to this legend to suit whatever font choice and size you like. If you want a border around the color swatch add EdgeForm in the Graphics list. To position the legend try using Labeled.
Labeled[(*your bar chart*), (*your legend*), {{Right, Center}}]