I have checked all Mathematica color schemes, and I think "Hue" is the most vibrant, beautiful one. However, it has one issue: the two ends of the spectrum are red (though, different reds). I like a spectrum from, say, red to blue. Is that possible to manipulate the Hue and remove the pink and second red?
Consider the following:
DensityPlot[Sin[x y], {x, 0.1, 1}, {y, 0.1, 1}, PlotLegends -> Automatic, Frame -> True, ColorFunction -> Hue]
The output is

As you see, the two extremes are red.


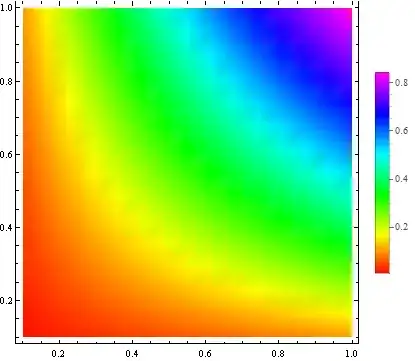
Blendfunction:Function@Blend[{Red, Yellow, Green, Cyan, Blue}, #]can be passed as a color function that will go from red to blue; alternately, I often pass(Hue[0.67*(1 - #)]&)as a color function argument when I want the color to vary from blue (low values) to red (high values). – nben Jun 19 '17 at 18:19