Bug introduced in 9.0 persisting through 13.2 or later
I've evaluated this code:
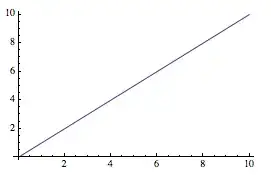
plot = Plot[x, {x, 0, 10}];
g = Rasterize[plot, ImageResolution -> 300];
Everything looks good except the ticks (on the axes); they are invisible! It seems that Mathematica draws ticks in a default size on the scaled image, and after the image is scaled down, they are made too small to be distinguished at all.
The more ImageResoltion I specify, the smaller the ticks are and the less pleasing the image is.
How can I get the axes ticks to look right?


ImageResolutionandRasterSizeat the same time?Rasterize[Plot[x, {x, 0, 10}], ImageResolution -> 512, RasterSize -> 512]looks good to me... – J. M.'s missing motivation Nov 18 '12 at 23:42