High resolution PNG export is handy for print quality plots, however tick marks are not scaling properly. Does anyone know a solution or a work-around, preferably for M7 (on Win7)?
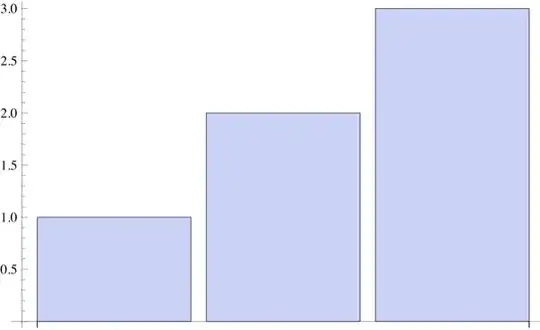
barchart = BarChart[{1, 2, 3}];
Export["demo.png", barchart, ImageResolution -> 300];
Import["demo.png", ImageSize -> 600]

Edit
It seems to me the best solution would just work on the ticks. If they are specified explicitly they scale properly.
However AbsoluteOptions[barchart, Ticks] is not helpful for respecifying the ticks. How can the intervals be determined automatically?
barchart = BarChart[{1, 2, 3}, Ticks -> {None,
    Flatten[Apply[{
        {0.2*#1 + #2, Null, {0.006, 0}},
        {0.4*#1 + #2, Null, {0.006, 0}},
        {0.6*#1 + #2, Null, {0.006, 0}},
        {0.8*#1 + #2, Null, {0.006, 0}},
        {#1 + #2, NumberForm[#1 + #2, {2, 1}],
         {0.01, 0}}} &,
      {{0.5, 0}, {0.5, 0.5}, {0.5, 1},
       {0.5, 1.5}, {0.5, 2}, {0.5, 2.5}}, {1}], 1]}];
Export["demo.png", barchart, ImageResolution -> 300];
Import["demo.png", ImageSize -> 600]


PDFand get the proper tick sizing usingExport["demo.pdf", barchart, ImageSize -> 600, ImageResolution -> 600]-- this could then be rasterized. Is this of use to you? Actually, since your question is focused on export I think it is, and that perhaps it's not a duplicate after all. Sorry to have been hasty. :-/ – Mr.Wizard Mar 19 '13 at 11:35