I need to plot the polar equation $r^2=\cos\theta$, but I could not find any built-in command in Mathematica to do so. Is there any (simple) way to plot an implicit polar equation?
Asked
Active
Viewed 1,508 times
2 Answers
2
You can use Mathematica to figure out what the corresponding relationship is in cartesian coordinates,
r^2 == Cos[th] /. {r -> Sqrt[x^2 + y^2], th -> ArcTan[x, y]}
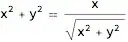
Using ContourPlot to plot this:
ContourPlot[
 x^2 + y^2 == x/Sqrt[x^2 + y^2],
 {x, 0, 1}, {y, -1, 1}
 ]
C. E.
- 70,533
- 6
- 140
- 264
2
How about:
PolarPlot[Sqrt[Cos[th]], {th, 0, 2 \[Pi]}]
Ruud3.1415
- 842
- 4
- 20
-
Well, the question is "Is there any way to draw the graph of implicit polar equations?"
PolarPlotworks when the relationship is explicit, but not when it is implicit. However, it can be used for the given example, so still worth to mention. – C. E. Jul 03 '17 at 18:46 -
@C.E. It could be smth like
PolarPlot[Evaluate[r /. Solve[r^2 == Cos[th], r]], {th, 0, 2 \[Pi]}]– garej Jul 03 '17 at 19:09 -
@garej I was thinking about implicit relationships in polar coordinates where a corresponding explicit formula is hard or impossible to find. Take f.e.
Solve[r^2 == Cos[r th], r], this cannot be solved withSolve, and hence cannot be plotted withPolarPlot. But it can be plotted withContourPlot. – C. E. Jul 03 '17 at 19:17 -
-
true, technically is should be
PolarPlot[{-Sqrt[Cos[th]], Sqrt[Cos[th]]}, {th, 0, 2 \[Pi]}]– Ruud3.1415 Jul 10 '17 at 15:31 -
ContourPlotare well documented. Read aboutFrame(which you'll want to set toFalse) andAxes. – C. E. Jul 04 '17 at 05:02