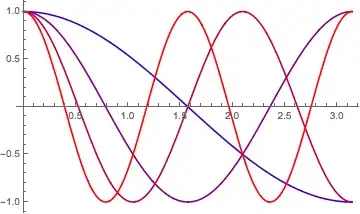
Suppose I have a simple function like $\cos(kx)$, and I am plotting a number of such functions with different values for $k$ as in:
Plot[Table[Cos[k x], {k, 1, 4, 1}], {x, 0, π}]
How can I color them depending on the $k$ parameter without setting it manually myself, as in:
Plot[Evaluate[Table[Cos[k x], {k, 1, 4, 1}]], {x, 0, π},
  PlotStyle -> Table[Blend[{Blue, Red}, k/4], {k, 1, 4, 1}]]
?
Plot[Evaluate[Table[Cos[k x], {k, 1, 4, 1}]], {x, 0, \[Pi]}]automatically colors them differently for eachk. Is that what you mean? If you want each plot colored specifically but you don't want to specify the colors "manually," then either I don't understand what you want or it cannot be accomplished. – Michael E2 Sep 25 '17 at 23:36Plot[Evaluate[Table[Style[Cos[k x], Blend[{Blue, Red}, k/4]], {k, 1, 4, 1}]], {x, 0, \[Pi]}]– Michael E2 Sep 25 '17 at 23:38Styleas @Michael just posted; see (8191) – Mr.Wizard Sep 25 '17 at 23:42