I prefer using Style in cases like this.
rp[x_, r_] := 1000 x (r + 1)/(r + x)
ratios = Table[10^n, {n, -2, 2, 4/10}];
em = Style[#, AbsoluteThickness[4]] &;
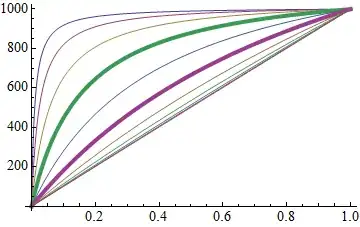
Plot[
MapAt[em, rp[x, #] & /@ ratios, 6],
{x, 0, 1},
Evaluated -> True
]

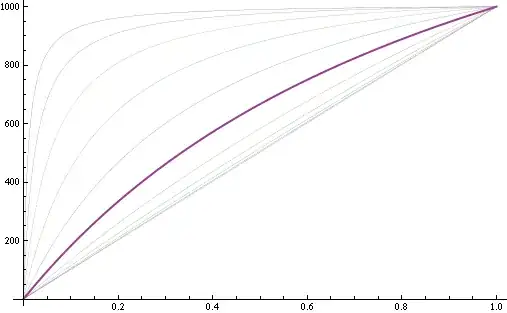
Plot[
 MapAt[em, rp[x, #] & /@ ratios, {{4}, {6}}],
 {x, 0, 1},
 Evaluated -> True
]
This works for styling directives except for color (by default), but colors are overridden by the default PlotStyle colors because of the output form, which is:
Style[{(* PlotStyle directive *), Line[. . .]}, (* Style directive *)]
If for whatever reason the Style method is desirable for colors as well one could use:
red = Style[#, Red, Thick] &;

Plot[
  MapAt[red, x Range@5, {{2}, {4}}],
  {x, 1, 10},
  Evaluated -> True
] /. Style[{__, L__Line}, s__] :> Style[{L}, s]
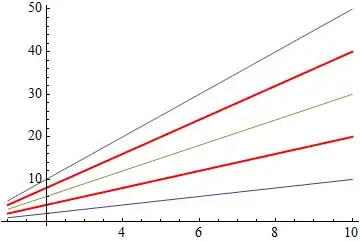
This discards all PlotStyle directives and keeps the Style directives for lines with Style.


PlotacceptedStyleas a function. – rcollyer Jul 11 '12 at 16:57DashedandThick, not color. – Mr.Wizard Jul 11 '12 at 17:38em(instead ofstyle) in the last example.(+1) – kglr Jul 12 '12 at 08:59styletoemto be less likeStyle, and forgot the second case. – Mr.Wizard Jul 12 '12 at 14:06