I have this graphic:

But I would like this:

without the yellow curve, of course.
I have this graphic:
But I would like this:
without the yellow curve, of course.
There are likely other ways, but this is one of the simplest:
curve = {x, Sqrt[x^2 + 1]};
nv = Normalize[Cross[D[curve, x]]];

With[{n = 30, h = 1/10},
    ParametricPlot[{curve, curve + h Sin[n x] nv} // Evaluate, {x, -2, 2}]]

This is another simple way. The idea is to plot a $\cos$ function, by changing its frequency and amplitude, you can adjust the twisting needed
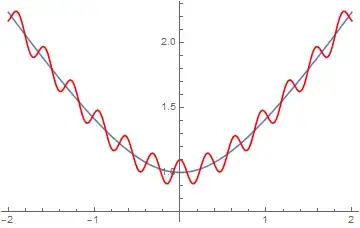
f1[x_]:=Sqrt[x^2+1]
data=Table[z0= 1/10 Cos[50 x];z1=f1[x];{x,z0+z1},{x,-2,2,.02}];
Show[Plot[f1[x],{x,-2,2},AxesOrigin->{0,.7}],
         ListLinePlot[data,PlotStyle->Red]]

This one has smaller frequency
data=Table[z0=1/10 Cos[20 x];z1=f1[x];{x,z0+z1},{x,-2,2,.02}];

Manipulate[
 data = Table[z0 = h Cos[w x];
   z1 = f1[x]; {x, z0 + z1}, {x, -2, 2, .02}];
 Show[Plot[f1[x], {x, -2, 2}, AxesOrigin -> {0, .7}],
  ListLinePlot[data, PlotStyle -> Red]],
 {{h, .1, "amplitude"}, 0, .5, .01, Appearance -> "Labeled"},
 {{w, 20, "frequency"}, 1, 100, 1, Appearance -> "Labeled"},
 TrackedSymbols :> {h, w},
 Initialization :>
  (
   f1[x_] := Sqrt[x^2 + 1];
   )
 ]
PlotStyleto change, e.g, line colors... – Henrik Schumacher Mar 05 '18 at 10:53