Update: Labeling the 4 regions defined by 2 functions:
ClearAll[f, g, h]
f = #^2 + #3^2 - #2^2 - 4 # #2 + 2 # #3 &;
g = #^2 + #3^2 - 9 #2^2 - 4 # #2 + 2 # #3 &;
h = And @@ Thread[0 <= {#, #2, #3} <= 100] &;
regions = Tuples[And[#@f[a, b, c] & /@ #, #@g[a, b, c] & /@ #]] &@{Positive, Negative};
labels = {"f > 0\ng > 0", "f > 0\ng < 0", "f < 0\ng > 0", "f < 0\ng < 0"};
SeedRandom[1]
positions = N[Mean /@
  ({a, b, c} /. FindInstance[# && h[a, b, c], {a, b, c}, Reals, 7] & /@ regions)];
labelsandpositions = Select[Transpose[{labels, positions}], FreeQ[#, a + b + c] &];
insets = Graphics3D[Inset[ Graphics[Text[Style[#, 16]]], #2] & @@@ labelsandpositions];
cp = Show[ContourPlot3D[#[a, b, c] == 0, {a, 0, 100}, {b, 0, 100}, {c, 0, 100},
  ContourStyle -> Texture[Graphics[Text[Style[#2, 48, Black]], Background -> #3]]] & @@@
    Transpose[{{f, g}, {"f == 0", "g == 0"}, Opacity[.7, #] & /@ {Red, Blue}}]];
rp = RegionPlot3D[h[a, b, c], {a, 0, 100}, {b, 0, 100}, {c, 0, 100},
   AxesLabel -> Automatic, BoundaryStyle -> None,
   MeshFunctions -> {f, g}, Mesh -> {{0}, {0}},
   MeshShading -> {Opacity[.5, #]&/@{Green, Yellow}, Opacity[.5, #]&/@{Purple, Cyan}}];
Show[rp, cp, insets, PlotRange -> All]

Note: For the given functions f and g the region f < 0 && g > 0 is empty.
Original answer:
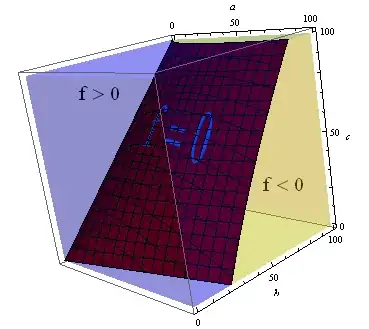
ClearAll[f, h, a, b, c]
f = #^2 + #3^2 - #2^2 - 4 # #2 + 2 # #3 &;
h = 0 <= # <= 100 && 0 <= #2 <= 100 && 0 <= #3 <= 100 &;
plot = ContourPlot3D[f[a, b, c] == 0, {a, 0, 100}, {b, 0, 100}, {c, 0, 100},
  ContourStyle -> Texture[Graphics[Text[Style["f = 0", 64, Cyan]], Background -> Red]]];
Show[RegionPlot3D[h[a, b, c], {a, 0, 100}, {b, 0, 100}, {c, 0, 100},
   AxesLabel -> Automatic, BoundaryStyle -> None,
   MeshFunctions -> {f}, Mesh -> {{0}},
   MeshShading -> {Opacity[.25, Yellow], Opacity[.25, Blue]}],
 plot, Graphics3D[{Inset[Graphics[Text[Style["f > 0", 20]]], {25, 25, 85}],
    Inset[Graphics[Text[Style["f < 0", 20]]], {85, 85, 25}]}]]


Show[RegionPlot3D[ 0 <= A <= 100 && 0 <= B <= 100 && 0 <= C <= 100, {A, 0, 100}, {B, 0, 100}, {C, 0, 100}, AxesLabel -> Automatic, BoundaryStyle -> Opacity[0], MeshFunctions -> {#^2 + #3^2 - #2^2 - 4 # #2 + 2 # #3 &}, Mesh -> {{0}}, MeshShading -> {Opacity[.25, Yellow], Opacity[.25, Blue]}], plot, Graphics3D@Text["f > 0", {20, 20, 75}], Graphics3D@Text["f < 0", {80, 80, 25}]]? – kglr May 22 '18 at 05:34ClearAll[f, g] f[a_, b_, c_] := a^2 + c^2 - b^2 - 4 a b + 2 a c; g[a_, b_, c_] := a^2 + c^2 - 9 b^2 - 4 a b + 2 a c; RegionPlot3D[ 0 <= a <= 100 && 0 <= b <= 100 && 0 <= c <= 100, {a, 0, 100}, {b, 0, 100}, {c, 0, 100}, AxesLabel -> Automatic, BoundaryStyle -> None, MeshFunctions -> {f[#, #2, #3] &, g[#, #2, #3] &}, Mesh -> {{0}, {0}}, MeshShading -> {{Opacity[.5, Green], Opacity[.5, Blue]}, { Opacity[.5, Orange], Opacity[.5, Red]}}]for the updated question? – kglr May 22 '18 at 06:27MeshFunction. How are the various regions I mentioned in my question identified? – Subho May 22 '18 at 06:43