31

Consider the following code:

Show[{Graphics3D[{Opacity[0.2], Sphere[], Opacity[1.0], Blue, 
Polygon[{{-.2, -.3, -.3}, {-.2, .3, -.3}, {-.2, .3, .3}, {-.2, \
-.3, .3}}]}], 
ParametricPlot3D[{Sin[th] Cos[ph], Sin[th] Sin[ph], Cos[th]}, {th, 
0, Pi}, {ph, 0, 2 Pi}, 
RegionFunction -> Function[{x, y, z}, Abs[x] < .9], 
PlotRange -> {-1, 1}, PlotStyle -> Red, Mesh -> None]}]

Mathematica graphics

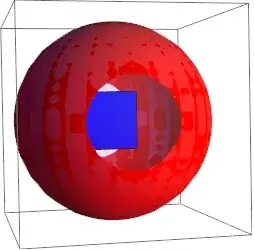
(Doctored somewhat from another question on this site.) It produces a sphere, with an opaque red surface, except for two "portholes", which allow one to see the blue rectangle inside.

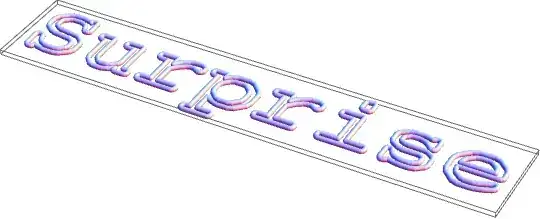
Now consider the following minor tweak, replacing the square by some text:

Show[{Graphics3D[{Opacity[0.2], Sphere[], Opacity[1.0], Blue, 
Text["Surprise!", {0, 0, 0}]}], 
ParametricPlot3D[{Sin[th] Cos[ph], Sin[th] Sin[ph], Cos[th]}, {th, 
0, Pi}, {ph, 0, 2 Pi}, 
RegionFunction -> Function[{x, y, z}, Abs[x] < .9], 
PlotRange -> {-1, 1}, PlotStyle -> Red, Mesh -> None]}]

Mathematica graphics

The output (which I don't know how to save as a rotating GIF [side question?]) shows the blue text over the red sphere, whether or not I am "looking" through the porthole or not.

The reason for this is in the help:

Text is drawn in front of all other objects.

Is there way to treat Text like other Graphics primitives, so that indeed it will be a "Surprise!" when you look through the porthole? That is, to get behavior similar to that of the blue rectangle?

Perhaps I should clarify I am most interested in being able to change the "z order" of the Text. But the fact that it doesn't rotate with the rest of the Graphics objects (using the mouse) is also kind of annoying.

Thanks!

Mr.Wizard
  • 271,378
  • 34
  • 587
  • 1,371
Steve D
  • 2,199
  • 1
  • 17
  • 22

3 Answers3

29

You can use Inset:

  Show[{Graphics3D[{Opacity[0.2], Sphere[], Opacity[1.0], Blue, 
  Inset[Graphics[Text[Style["Surprise!", Green, 24]]], {0, 0, 0}]}],
  ParametricPlot3D[{Sin[th] Cos[ph], Sin[th] Sin[ph], Cos[th]}, {th, 
   0, Pi}, {ph, 0, 2 Pi}, 
  RegionFunction -> Function[{x, y, z}, Abs[x] < .9], 
  PlotRange -> {-1, 1}, PlotStyle -> Red, Mesh -> None]}]

which gives

enter image description here

Alternatively, you can use Texture:

  text = Style["Surprise!!", 128];
  vrtxtxtrcoords = {{0, 0}, {1, 0}, {1, 1}, {0,  1}}; 
  Show[{Graphics3D[{Texture[text], 
  Polygon[{{-.2, -.3, -.3}, {-.2, .3, -.3}, {-.2, .3, .3}, {-.2,  -.3, .3}},  
  VertexTextureCoordinates -> vrtxtxtrcoords]}, 
  Lighting -> "Neutral"], 
  ParametricPlot3D[{Sin[th] Cos[ph], Sin[th] Sin[ph], Cos[th]}, {th, 0, Pi}, {ph, 0, 2 Pi}, 
  RegionFunction -> Function[{x, y, z}, Abs[x] < .9], 
  PlotRange -> {-1, 1}, PlotStyle -> Red, Mesh -> None]}]

which gives

enter image description here

kglr
  • 394,356
  • 18
  • 477
  • 896
23

For this purpose I made a function that puts an arbitrary expression into a 3D graphic. It's described on this page, going back originally to this MathGroup post, I'll copy the code here:

label3D[s_, pos_, xVec_, tiltAngle_, opts : OptionsPattern[]] := 
  Module[{ra, width, height, r}, 
   ra = Rasterize[
     Style[HoldForm[s], FilterRules[{opts}, Options[Style]], 
      Magnification -> 10], 
     Evaluate@
      Apply[Sequence, FilterRules[{opts}, Options[Rasterize]]], 
     "Image"];
   {width, height} = ImageDimensions[ra];
   r = SetAlphaChannel[ra, 
     With[{color = 
        Apply[List, 
         ColorConvert[
          "TransparentColor" /. {opts} /. {"TransparentColor" -> 
             Apply[RGBColor, ImageData[ra][[2, 2]]]}, "RGB"]]}, 
      Binarize[ra, (Norm[# - color] > .005) &]]];
   Translate[(* //to make lefthand corner pos*)
    Rotate[(*   //around z axis*)
     Rotate[(* //around y axis*)
      Rotate[(* //tilt around x axis*)
       Scale[(*//to make width equal|
        xVec|*){EdgeForm[FrameStyle /. {opts} /. FrameStyle -> None], 
         Texture[ImageData@r],(* //
         Texture fills polygon initially in the xz plane*)
         Polygon[{{0, 0, 0}, {width, 0, 0}, {width, 0, height}, {0, 0,
             height}}, 
          VertexTextureCoordinates -> {{0, 0}, {1, 0}, {1, 1}, {0, 
             1}}]}, Norm[xVec]/width, {0, 0, 0}], 
       tiltAngle, {1, 0, 0}],(* //x rotation*)
      Arg[Chop@N[Norm[xVec[[1 ;; 2]]] + I xVec[[3]]]], {0, -1, 
       0}],(* //y rotation*)
     Arg[Chop@N[xVec[[1]] + I xVec[[2]]]], {0, 0, 1}],(* //z rotation*)
    pos]];
SetAttributes[label3D, HoldFirst]

With this, you can draw your test as follows:

Show[{Graphics3D[{{Opacity[0.2], Sphere[]},
    {Glow[Purple], 
     With[{position = {0, -.5, 0}, direction = {0, Cos[.1], Sin[.1]}, 
       tiltAngle = 0},
      label3D["Surprise!", position, direction, tiltAngle, 
       FontColor -> Blue, FontFamily -> "Helvetica"]
      ]}
    }], ParametricPlot3D[{Sin[th] Cos[ph], Sin[th] Sin[ph], 
    Cos[th]}, {th, 0, Pi}, {ph, 0, 2 Pi}, 
   RegionFunction -> Function[{x, y, z}, Abs[x] < .9], 
   PlotRange -> {-1, 1}, PlotStyle -> Red, Mesh -> None]},
 ViewPoint -> {2, .1, .5}]

surprise

Note that although the text was rasterized in this approach, the background is transparent. The text also maintains its orientation with respect to the other objects. I'm going with this rasterized approach because 3D graphics eventually always require rasterization anyway when you want to export them at a reasonable file size.

Since I was just doing another gif animation, I thought this post could also use one:

frames = Table[
  Show[{Graphics3D[{{Opacity[0.2], 
       Sphere[{0, 0, 0}, .99]}, {Glow[Purple], 
       With[{position = {0, -.5, 0}, 
         direction = {0, Cos[.1], Sin[.1]}, tiltAngle = 0}, 
        label3D["Surprise!", position, direction, tiltAngle, 
         FontColor -> Blue, FontFamily -> "Helvetica"]]}}], 
    ParametricPlot3D[{Sin[th] Cos[ph], Sin[th] Sin[ph], Cos[th]}, {th,
       0, Pi}, {ph, 0, 2 Pi}, PlotPoints -> 30, 
     RegionFunction -> Function[{x, y, z}, Abs[x] < .9], 
     PlotRange -> {-1, 1}, PlotStyle -> Red, Mesh -> None]}, 
   ViewVector -> { 
     3.5 {Cos[Pi/4 (1 - Sin[a/2]^2)], 
       Cos[a] Sin[Pi/4 (1 - Sin[a/2]^2)], 
       Sin[a] Sin[Pi/4 (1 - Sin[a/2]^2)]}, {0, 0, 0}}, 
   ViewVertical -> {0, 0, 1}, ViewAngle -> .6, 
   ViewCenter -> {0, 0, 0}, Boxed -> False]
  , {a, 0, 2 Pi, Pi/20}];
Export["surprise.gif", frames, 
 "DisplayDurations" -> 
  Join[.03 & /@ Range[20], {1}, .03 & /@ Range[20]]]

gif animation

Jens
  • 97,245
  • 7
  • 213
  • 499
16

You can generate actual 3D data describing the text by Importing from PDF.

wordData = ImportString[ExportString["Surprise", 
  "PDF"], "PDF"][[1, 1, 2, 1, 1, 2]];
Graphics3D[Tube[#, 0.2] & /@ Map[Append[#, 0] &, wordData, {2}]]

enter image description here

Or, in reference to Sjoerd's comment to the OP,

wordData = ImportString[ExportString[Style["\[Euro]", 
  FontFamily -> "Times"], 
    "PDF"], "PDF"][[1, 1, 2, 1, 1, 2]];
Graphics3D[Polygon /@ Map[Append[#, 0] &, wordData, {2}]]

enter image description here

Then, you can insert that in your image. The Tube primitive doesn't run too smoothly, though. Let's try a line.

word3D =Line /@  Map[{0,-0.5,-0.2}+Prepend[#,0]&,
  wordData/40,{2}] ;
Show[{Graphics3D[{{Opacity[0.2], Sphere[]}, word3D}],
  ParametricPlot3D[{Sin[th] Cos[ph], Sin[th] Sin[ph], Cos[th]}, 
    {th, 0, Pi}, {ph, 0, 2 Pi}, 
    RegionFunction -> Function[{x, y, z}, Abs[x] < .9], 
    PlotRange -> {-1, 1}, PlotStyle -> Red, Mesh -> None]}]
Mark McClure
  • 32,469
  • 3
  • 103
  • 161
  • This is problematic with closed-shape characters. "oae" etc. do not render properly because holes are filled. Is there a workaround for that? – Yves Klett Apr 30 '12 at 09:13
  • @Yves Imported PDF represents letters using FilledCurve, which represents holes easily. There should be enough information in the FilledCurve to extend to a 3D polygon representing the character with a hole. That's a bit more work, though, and is exactly why I used Tube and Line, rather than Polygon for the main answer. – Mark McClure Apr 30 '12 at 11:02
  • Yup, with versions prior to 7 this worked just fine. That is why I fervently wish that FilledCurve were adapted to work as a 3D primitive as well. That should be awesome. I think David Park´s Presentation package offers something with a ParametricPlot based workaround, but workaround it remains... – Yves Klett Apr 30 '12 at 11:26
  • @YvesKlett There's a Demonstration by Michael Schreiber that uses this Import[Export PDF technique to get polygons with holes projected onto a cube. That might help: http://demonstrations.wolfram.com/NumberedCube/ – Mark McClure Apr 30 '12 at 11:31