-3

I am trying to help this guy here to vizualise the integration volume. How can I plot the different integrals ie a ball and the ball adjusted by a trigonometric function?

Integrals needing visual cue: what does their spanned volume look like?

He was wondering why the first integral is not spherical. I want to provide some sort of visual cue in this kind of issues.

$$\int_0^{2\pi}\int_0^{\pi} d\theta d\phi = 2 \pi^2$$

$$\int_0^{2\pi}\int_0^{\pi} \sin\theta d\theta d\phi = 4 \pi$$

hhh
  • 2,603
  • 2
  • 19
  • 30
  • Have you read the help page for SphericalPlot3D? – whuber Jan 08 '13 at 18:51
  • The easiest way to plot a sphere is Graphics3D[Sphere[]]. Are you wishing to parametrize the surface with spherical coordinates? – Michael E2 Jan 08 '13 at 18:52
  • Can I do some of the commands with WolframAlpha? http://www.wolframalpha.com/input/?i=++SphericalPlot3D%28%7B1%7D%2C%7B%5Ctheta%2C0%2C2%5Cpi%7D%2C%7B%5Crho%2C-%5Cpi%2F2%2C%5Cpi%2F2%7D%29 – hhh Jan 08 '13 at 18:59
  • @MichaelE2 I try to help the guy by visualizing different volumes by slightly changing parametrization, last sentence. – hhh Jan 08 '13 at 19:04
  • Perhaps this demonstration would help. – Michael E2 Jan 08 '13 at 19:05
  • 6
    Ok, someone had to say this and it might as well be me: Not only did you use MATLAB code for the example, you gave an incorrect example that generated an arbitrary plot and wanted us to provide an explanation as to why your MATLAB plot fails. On top of this, you just toss in a casual "eh, it's similar to Mathematica so fix my MATLAB code" in the hopes that it'll fly here... Please, if you need help with MATLAB, ask at [so]. If you want to ask help here, then please show effort in Mathematica (or at least show fully working code in language X with your best attempt at translating it). – rm -rf Jan 08 '13 at 23:21
  • @Hypnotoad thank you, moved the matlab question here. I did not know that I could ask matlab questions on a site, thank you for the info! – hhh Jan 09 '13 at 03:44

2 Answers2

5

Here's another demonstration (CDF, v9 but works with lower versions) I use in class:

Manipulate[
 With[{P0 = ρ (Sin[ϕ] {Cos[θ], Sin[θ], 0} + {0, 0, Cos[ϕ]}),
 $θColor = Red, $ϕColor = Darker[Blue], $ρColor = Brown},
  Graphics3D[{
    {PointSize[Medium], Point[P0], 
     Line[{{0, 0, 0}, #} & /@ (3 IdentityMatrix[3])], Opacity[0.3], 
     Line[{{0, 0, 0}, #} & /@ (-3 IdentityMatrix[3])]}, {
     {Opacity[0.3], 
      EdgeForm[Directive[Thickness[Medium], Opacity[0.3]]], 
      Polygon[{{0, 0, 0}, P0, {P0[[1]], P0[[2]], 0}}], $θColor,
       EdgeForm[
       Directive[Thickness[Medium], 
        If[Δρ == 0 && Δϕ == 0 && Δθ == 0, Opacity[1],
       Opacity[0.3]], $θColor]], 
      Polygon[Append[
        Table[0.3 {Cos[t], Sin[t], 0}, {t, 
          Append[Range[0, θ, 0.05], θ]}], {0, 0, 
         0}]], $ϕColor, 
      EdgeForm[
       Directive[Thickness[Medium], 
        If[Δρ == 0 && Δϕ == 0 && Δθ == 0,
       Opacity[1], Opacity[0.3]], $ϕColor]], 
      Polygon[Append[
        Table[0.5 (Sin[t] {Cos[θ], Sin[θ], 0} + {0, 0, 
             Cos[t]}), {t, 
          Append[Range[0, ϕ, 0.05], ϕ]}], {0, 0, 0}]]},
     Line[{{P0, {0, 0, P0[[3]]}}, {{P0[[1]], P0[[2]], 0}, {P0[[1]], 0,
          0}}, {{P0[[1]], P0[[2]], 0}, {0, P0[[2]], 0}}}], 
     Point[DiagonalMatrix[P0]]
     },
    Which[
     Δρ == 0 && Δϕ == 0 && Δθ == 0, 
      { Thick, $ρColor, Line[{{0, 0, 0}, P0}] },
     Δρ == 0 && Δϕ == 0(*&&Δθ>0*), {
      First@
       ParametricPlot3D[ρ (Sin[ϕ] {Cos[t], Sin[t], 0} + {0, 
            0, Cos[ϕ]}), {t, θ, θ + Δθ}, 
        PlotStyle -> Directive[Thick, $θColor]]
      },
     Δρ == 0 &&(*Δϕ>
      0&&*)Δθ == 0, {
      First@
       ParametricPlot3D[ρ (Sin[s] {Cos[θ], Sin[θ], 
             0} + {0, 0, 
            Cos[s]}), {s, ϕ, ϕ + Δϕ}, 
        PlotStyle -> Directive[Thick, $ϕColor]]
      },
     (*Δρ>
     0&&*)Δϕ == 0 && Δθ == 0, {
      First@
       ParametricPlot3D[
        r (Sin[ϕ] {Cos[θ], Sin[θ], 0} + {0, 0, 
            Cos[ϕ]}), {r, ρ, ρ + Δρ}, PlotStyle -> Directive[Thick, $ρColor]]
      },
     Δρ == 0(*&&Δϕ>
     0&&Δθ>0*), {
      First@
       ParametricPlot3D[ρ (Sin[s] {Cos[t], Sin[t], 0} + {0, 0,  Cos[s]}),
          {s, ϕ, ϕ + Δϕ},
          {t, θ, θ + Δθ}, Mesh -> None, 
        PlotStyle -> Directive[Lighter[$ρColor]]]
      },
     (*Δρ>0&&Δϕ>
     0&&*)Δθ == 0, {
      First@
       ParametricPlot3D[ r (Sin[s] {Cos[θ], Sin[θ], 0} + {0, 0, Cos[s]}),
         {s, ϕ, ϕ + Δϕ},
         {r, ρ, ρ + Δρ}, Mesh -> None, 
        PlotStyle -> Lighter[$θColor]]
      },
     (*Δρ>
     0&&*)Δϕ == 0(*&&Δθ>
     0*), {
      First@
       ParametricPlot3D[
        r (Sin[ϕ] {Cos[t], Sin[t], 0} + {0, 0, Cos[ϕ]}),
        {r, ρ, ρ + Δρ},
        {t, θ, θ + Δθ},
        Mesh -> None, PlotStyle -> Lighter[$ϕColor]]
      },
     True(*Δρ>0&&Δϕ>
     0&&Δθ>0*), {
      First@
       ParametricPlot3D[ρ (Sin[s] {Cos[t], Sin[t], 0} + {0, 0, Cos[s]}),
           {s, ϕ, ϕ + Δϕ},
           {t, θ, θ + Δθ}, Mesh -> None, 
        PlotStyle -> 
         Dynamic@Directive[Lighter[$ρColor], Opacity[opacity]]], 
      First@
       ParametricPlot3D[
        r (Sin[s] {Cos[θ], Sin[θ], 0} + {0, 0, Cos[s]}),
           {s, ϕ, ϕ + Δϕ},
           {r, ρ, ρ + Δρ}, Mesh -> None, 
        PlotStyle -> 
         Dynamic@Directive[Lighter[$θColor], 
           Opacity[opacity]]], 
      First@ParametricPlot3D[
        r (Sin[ϕ] {Cos[t], Sin[t], 0} + {0, 0, Cos[ϕ]}),
           {r, ρ, ρ + Δρ},
           {t, θ, θ + Δθ}, Mesh -> None, 
        PlotStyle -> 
         Dynamic@Directive[Lighter[$ϕColor], Opacity[opacity]]], 
      First@ParametricPlot3D[(ρ + Δρ) (Sin[s] {Cos[t], Sin[t], 0} + {0, 0, Cos[s]}),
           {s, ϕ, ϕ + Δϕ},
           {t, θ, θ + Δθ}, Mesh -> None, 
        PlotStyle -> 
         Dynamic@Directive[Lighter[$ρColor], Opacity[opacity]]], 
      First@ParametricPlot3D[
        r (Sin[s] {Cos[θ + Δθ], 
             Sin[θ + Δθ], 0} + {0, 0, Cos[s]}),
           {s, ϕ, ϕ + Δϕ},
           {r, ρ, ρ + Δρ}, Mesh -> None, 
        PlotStyle -> 
         Dynamic@Directive[Lighter[$θColor], 
           Opacity[opacity]]], 
      First@ParametricPlot3D[
        r (Sin[ϕ + Δϕ] {Cos[t], Sin[t], 0} + {0, 0, Cos[ϕ + Δϕ]}),
           {r, ρ, ρ + Δρ},
           {t, θ, θ + Δθ}, Mesh -> None, 
        PlotStyle -> 
         Dynamic@Directive[Lighter[$ϕColor], Opacity[opacity]]]
      }
     ]
    },
   SphericalRegion -> True, PlotRange -> 2, Lighting -> "Neutral"
   ]],
 Row[{Control[{{ρ, 1}, 0, 2, ImageSize -> Small}], 
   Control[{Δρ, 0, 1, ImageSize -> Small}]}, 
  Spacer[1]],
 Row[{Control[{ϕ, 0, π, ImageSize -> Small}], 
   Control[{Δϕ, 0, π, ImageSize -> Small}]}, 
  Spacer[1]],
 Row[{Control[{θ, 0, 2 π, ImageSize -> Small}], 
   Control[{Δθ, 0, 2 π, 
     ImageSize -> Small}]}, Spacer[1]],
 {{opacity, 1}, 0, 1}, ControlPlacement -> Left
 ]

enter image description here

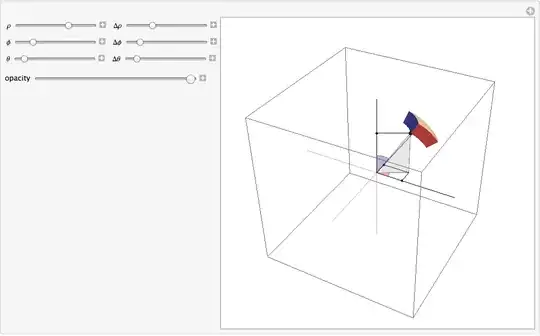
I might add that the reason for submitting it was that it shows, if one moves the ϕ slider, that the surface area element $dS$ or volume element $dV$ decreases as ϕ moves toward 0, or $\pi$, which is in part what his question was about.

rm -rf
  • 88,781
  • 21
  • 293
  • 472
Michael E2
  • 235,386
  • 17
  • 334
  • 747
  • I got several ParametricPlot3D::nlnum and Visualization`Core`ParametricPlot3D::invfuncs errors when using it. It happens when all three Δ* values are set. Here's a case when this happens: {opacity = 1, Δθ = 1, Δρ = 1, Δφ = 1, θ = 0, ρ = 1, φ = 0}. I haven't looked through the code to see where or why this occurs, but it'll be quicker for you to find it – rm -rf Jan 08 '13 at 22:31
  • @Hypnotoad Thanks, but when I use your settings I get no messages. Random moving generates no messages either. Perhaps something global was defined in your session? – Michael E2 Jan 08 '13 at 22:50
  • Clean session, I'm also getting errors same as Hypnotoad. Also, if this is used in any sort of teaching setting, I would advice cleaning it up to improve readability. – jVincent Jan 08 '13 at 23:02
  • Same here. I get the errors as soon as I change any of the Δ... – einbandi Jan 09 '13 at 00:14
  • Thanks everyone for checking it out. Sorry that it's so long - I thought I could just paste an old thing. @jVincent: By readability, do you mean the code, the output, or both? – Michael E2 Jan 09 '13 at 00:20
  • @MichaelE2 I like the output, I meant the code. For one thing, you have a huge load of code dealing with special cases for plotting the volume, why not just put this into a single function like buildVolume that way both the graphics generation is easier to read, and the whole special case handling. – jVincent Jan 09 '13 at 00:32
  • @jVincent Thanks for explaining. I can't remember exactly how I wrote it (over two years ago), but the output was to stand alone and not depend on any global symbols being defined. I know, buildVolume can be localized. The students don't see the code, only the output. It's for a calculus class. I was trying to help the OP with the last line in his question. I didn't mean it to be an example program (sorry if that's bad form), but I did mean that it should work! It wasn't until I suspected the pasted code was corrupted that I could fix my answer. – Michael E2 Jan 09 '13 at 01:06
5

Here's a very basic demonstration:

Manipulate[
 ParametricPlot3D[{Sin[theta] Cos[phi], 
   Sin[theta] Sin[phi], Cos[theta]},
  {theta, 0, t}, {phi, 0, p},
  PlotRange -> {{-1, 1}, {-1, 1}, {-1, 1}}],
 {t, 0.1, Pi}, {p, 0.1, 2 Pi}]

enter image description here

einbandi
  • 4,024
  • 1
  • 23
  • 39