10

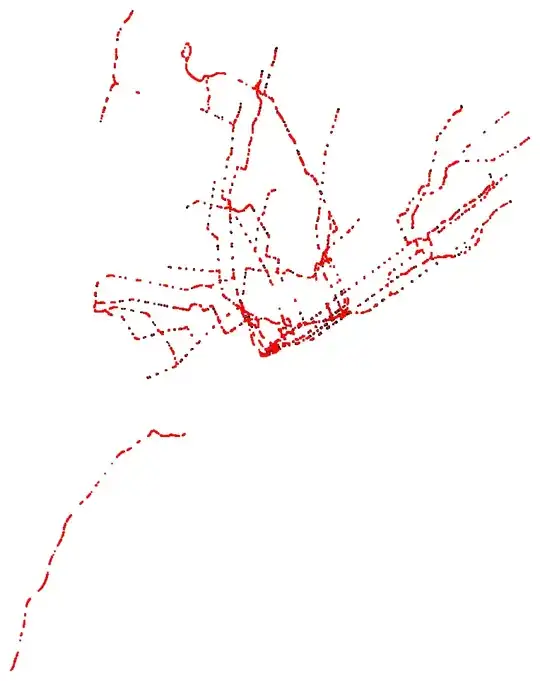
I have a dataset composed of points specified in {Latitude,Longitude} format. Call it latlong for the purposes of this question. It displays properly with

Graphics[{Point /@ 
   Map[GeoGridPosition[GeoPosition[#], 
       "Mercator"][[1]] &, {latlong}, {2}]}]

I also have a shape file that contains the boundaries of the counties in which the latlong points reside. If I query Import[demo.shp", "CoordinateSystemInformation"], I get

"GEOGCS" -> {"GCS_North_American_1983", 
  "DATUM" -> {"North_American_Datum_1983", 
    "SPHEROID" -> {"GRS_1980", 6.37814*10^6, 298.257}}, 
  "PRIMEM" -> {"Greenwich", 0.}, "UNIT" -> {"Degree", 0.0174533}}

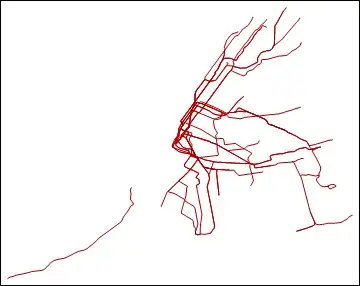
and if I just Import the shape file, it displays correctly on screen.

I would like to display the points from latlong within the county borders from demo.shp. I have not been able to figure out how.

I appreciate that this is as much a GIS question as it is a Mathematica question, but I hope somebody here can help.

Sjoerd C. de Vries
  • 65,815
  • 14
  • 188
  • 323
Michael Stern
  • 4,695
  • 1
  • 21
  • 37

3 Answers3

10

The most likely cause of your problem is that you are swapping lat and long coordinates.

Your latlong definition in the .NB file provided goes like this:

latlong = {{40.660323`, -73.997952`}, {40.660489`, -73.99822`}, {40.654365`, -74.004113`},...

That's New York. Simply plotting without projection gives:

m1=Graphics@Point@latlong

Mathematica graphics

I seem to see Long Island and some other familiar features. Looks like a subway map.

Here is a publicly available SHP map of the subway lines:

Import["https://wfs.gc.cuny.edu/SRomalewski/MTA_GISdata/June2010_update/nyctsubwayroutes_100627.zip", "SHP"]

Mathematica graphics

Extracting some coordinates from that:

Cases[map, {_Real, _}, Infinity]

{{-74.015047, 40.703577}, {-74.015028, 40.703214}, {-74.014889, 40.702506}, ...

You can see that this has the latlongs in the reverse order. Plotting these points with your other latlong gives precisely the result you describe above.

Mathematica graphics

The solution is to map Reverse on these coordinates:

m2 = Graphics[{Red, Point@(Reverse /@ Cases[map, {_Real, _}, Infinity])}];
Show[m1,m2]

Mathematica graphics

Sjoerd C. de Vries
  • 65,815
  • 14
  • 188
  • 323
  • The fact that the answer was so straight-forward doesn't make me any less impressed with how well you figured it out. I should have noticed that my dataset was placing Far Rockaway in the upper left, but somehow I missed it. Thanks! – Michael Stern Jan 23 '13 at 21:02
  • nice detective work +1 – Mike Honeychurch Jan 23 '13 at 21:07
4
bg = Import["sample.shp"]
Show[bg, Graphics[Point@Reverse[latlong, {2}]]]

output

Tuku
  • 486
  • 2
  • 4
0

Lets start with a map of the USA:

 plot1 = Import["http://exampledata.wolfram.com/usamap.zip","Graphics"]

enter image description here

Now we can add points on top of the map easily:

 points = Transpose@{RandomReal[{-100, -90}, 50], RandomReal[{35, 47}, 50]};

 Show[plot1,  ListPlot[points, PlotStyle -> Directive[Red, PointSize[Large]]]]

enter image description here

David Slater
  • 1,525
  • 10
  • 13
  • I might be wrong, but I assume the OP's problem is not in combining the graphics but it in taking care they use the same coordinate system. I don't believe you address that problem here. – Sjoerd C. de Vries Jan 23 '13 at 20:00
  • correct, each renders correctly independently but placement and scale are very wrong when I combine them. I presume I'm messing up the coordinate system. – Michael Stern Jan 23 '13 at 20:13