3

I have an excel spreadsheet that I would like to plot in a 3D graph using mathematica. The X and Y values are the location of the cell, and the Z value is the number of the scale.

How can I import this into mathematica for plotting purposes?

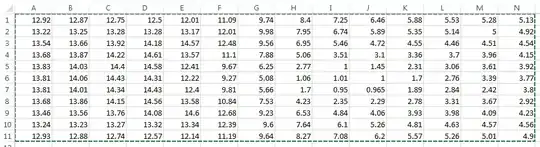
Here is what my data looks like. enter image description here

Sponge Bob
  • 765
  • 1
  • 8
  • 17
  • 1
    You can factor your Q into two parts: (1) data = Import["myFile.xls"] (if the file contains only a single worksheet, otherwise take parts). (2) Then you can transform this data to Graphics3D in a variety of ways. – alancalvitti Jan 25 '13 at 18:46
  • @alancalvitti that worked... if you add it as an answer I will select it. – Sponge Bob Jan 25 '13 at 19:07

1 Answers1

5
Flatten[MapIndexed[{Sequence @@ #2, #1} &, 
                Import["ExampleData/elements.xls"] [[1]], {2}], 1] // TableForm

Requested explanation:

Import["ExampleData/elements.xls"][[1]]

Gets the first sheet in the file

MapIndexed[{Sequence @@ #2, #1} &, ...... , {2}]

Generates tuples of the form {posx, posy, cellValue}

Flatten[........, 1]

Gets rid of extra nesting levels on the resulting list

// TableForm

Formats the output you see below

enter image description here

Mike Honeychurch
  • 37,541
  • 3
  • 85
  • 158
Dr. belisarius
  • 115,881
  • 13
  • 203
  • 453