3

I am very poor at visualization. I want to make a transparent "building" filled with gas. I wrote the following code for the building and it's fine.

 w = 100;
 l = 200;
 h = 30;
 m = 70;
 backwall = {{0, l, 0}, {w, l, 0}, {w, l, h}, {0, l, h}};
 side1 = {{0, 0, 0}, {0, 0, h}, {0, l, h}, {0, l, 0}};
 side2 = {{w, 0, 0}, {w, 0, h}, {w, l, h}, {w, l, 0}};
 floor = {{0, 0, 0}, {w, 0, 0}, {w, l, 0}, {0, l, 0}};
 top = {{0, 0, h}, {w, 0, h}, {w, l, h}, {0, l, h}};
 front = {{0, 0, 0}, {w, 0, 0}, {w, 0, h}, {0, 0, h}};
 leftRoof = {{0, 0, h}, {w/2, 0, m}, {w/2, l, m}, {0, l, h}};
 rightRoof = {{w, 0, h}, {w/2, 0, m}, {w/2, l, m}, {w, l, h}};
 fig = Graphics3D[{
   Transparent, Style[Polygon[{backwall, side1, side2, floor, front, leftRoof,rightRoof}],
   Lighting -> {{"Ambient", Green}}]},
   Boxed -> False,
   RotationAction -> "Clip"]

But in a second step, I want to fill the building with gas, which is also transparent. Why? Because after filling it with the gas, I will put points inside the building.

For this purpose, I wrote the following code.

data = RandomReal[60, {10, 3}];
data1 = RandomReal[60, {10, 3}];
redPoints = Graphics3D[{PointSize -> Large, Style[Point[#], Blue]} & /@ data, 
  Boxed -> False];
bluePoints = Graphics3D[{PointSize -> Large, Style[Point[#], Red]} & /@ data1, 
  Boxed -> False];
Show[{fig, redPoints, bluePoints}]

After evaluation of the above code, I am getting an image like this:

enter image description here

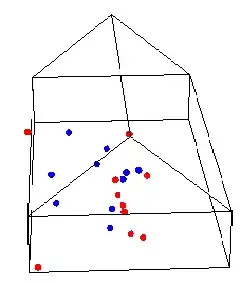
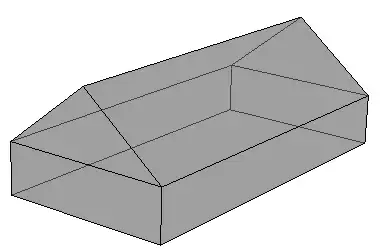
Transparent-building-wise and point-placement-wise this is fine; my problem is filling the building with gas. How can get the gas (light gray color) to fill the inside of the entire building. Can anyone help me?

m_goldberg
  • 107,779
  • 16
  • 103
  • 257
subbu
  • 2,304
  • 1
  • 13
  • 32

3 Answers3

7

RegionPlot3D creates a surface made of polygons, not a solid volume, so it gives the same result as simply making the original polygons partially transparent.

Adding the roof ends:

roofBack = {{w, l, h}, {w/2, l, m}, {0, l, h}};
roofFront = {{w, 0, h}, {w/2, 0, m}, {0, 0, h}};

This uses just the 9 building polygons rather than the hundreds created by RegionPlot3D:

building = {backwall, side1, side2, floor, front, 
 leftRoof, rightRoof, roofBack, roofFront};

Graphics3D[{Opacity[0.5, Gray], Polygon[building]}, Boxed -> False]

enter image description here

Notice that the walls are still picking up colour from the lights. As in the original code in the question, you can Style the polygons with their own ambient Lighting for a completely flat effect:

Graphics3D[{Opacity[0.5, Gray],
  Style[Polygon[building], Lighting -> {{"Ambient", White}}]
  }, Boxed -> False]

enter image description here

For a slightly nicer (IMO) effect, you could use VertexColors to fade the polygons with increasing z:

Graphics3D[{Opacity[0.5],
  Style[Polygon[building,
    VertexColors -> Map[0.5 + #[[3]]/80 &, building, {2}]],
   Lighting -> {{"Ambient", White}}]
  }, Boxed -> False]

enter image description here

Simon Woods
  • 84,945
  • 8
  • 175
  • 324
5

I'm a bit worried about this idea of filling a building with gas, to be honest. But perhaps some good old-fashioned CO2 would be OK.

gas =  Flatten[
   Table[{x, y, z}, 
      {x, 10, w - 10, 10}, 
      {y, 10, l - 10, 10}, 
      {z, 10, h - 10, 5}], 2];

Graphics3D[{
  Opacity[0.2, Gray], 
  Polygon[building], 
  White, 
  Opacity[0.1],
  Sphere[#, RandomInteger[{1, 10}]] & /@ gas}, 
  Lighting -> "Neutral",
  Boxed -> False]

You would need to develop a region-function that can fill the space more accurately.

gas

cormullion
  • 24,243
  • 4
  • 64
  • 133
2

I suggest something like

gas = RegionPlot3D[
  0 < x < 100 && 0 < y < 200 && z > 0 && z < 30 + x/2 && 
  z < 80 - x/2, {x, 0, 250}, {y, 0, 250}, {z, 0, 100}, 
  PlotStyle -> Directive[Gray, Opacity[0.5]], Mesh -> None]

Show[{fig, redPoints, bluePoints, gas}]

gas

cormullion
  • 24,243
  • 4
  • 64
  • 133
Iiss
  • 161
  • 3
  • Thanks for your answer,but RegionPlot was not fixed exactly inside the Building. little bit of gaps are there on the top,sides.I will try that.again thanks for your answer – subbu Feb 27 '13 at 09:41
  • subbu, I noticed that as well, that's why I qualified my answer with "something like". Consider my answer as a concept that requires further work. – Iiss Feb 27 '13 at 10:01
  • added picture - but used PlotPoints to 120 for better fit. Perhaps it's a heavy gas; Wolfium, perhaps - heavier than air? :) – cormullion Feb 27 '13 at 10:10
  • cormullion, this looks much better, and maybe if you use <= and >= rather than < and >, the gaps might disapear, and if I could just calculate the height of the roof, that might help as well, I'll get right to that... – Iiss Feb 27 '13 at 11:54