I would like to add a colour bar to a plot. I tried to use GraphicsRow for this. In a GraphicsRow, each item is given the same space, resulting in this:
Clear[colorbar]
colorbar[colorFunction_: Automatic, divs_: 25] :=
DensityPlot[y, {x, 0, .1}, {y, 0, 1}, AspectRatio -> Automatic,
PlotRangePadding -> 0, PlotPoints -> {2, divs}, MaxRecursion -> 0,
FrameTicks -> {None, Automatic, None, None},
ColorFunction -> colorFunction]
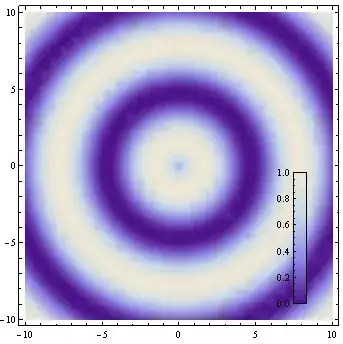
GraphicsRow[{DensityPlot[Sin[Norm[{x, y}]], {x, -10, 10}, {y, -10, 10}],
colorbar[]}]
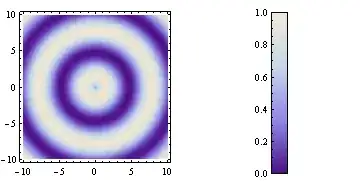
The colour bar has too much space around it. How can I specify the amount of space GraphicsRow should give a particular item?
Alternatively, what is a better way to include the colour bar?
Answer summary
After experimenting with this for a while, it seems that the situation is the following (simplified):
Gridand friends (Row,Column) will size the grid cells to fit each item individually (cells resized to fit items).GraphicsGridwill first set up a grid with fixed cell sizes, then fit each item into the cells (items resized to fit cells).
GraphicsGrid-like solutions are more convenient when the whole graphic need to be sized to a specification.
István's answer hacks GraphcisRow by setting a negative spacing and thus pushing the elements closer together. It's the most convenient for this situation, but it doesn't generalize for many cells.
R.M.'s solution suggests using Grid instead. This generalizes well, but requires pre-sizing all items individually, and no resizing is possible after (e.g. just before import).
Since GraphicsGrid is implemented in terms of Inset, the most general easily resizable solution would be implementing a GraphicsGrid-like construct where cell size ratios can be specified. kguler's last answer illustrates this best.
Several other solutions used Inset directly as well. A problem with resizing these solutions can be that the aspect ratio of elements is size-dependent (due to the absolute sizes used in ImagePadding), so how they fit into a fixed aspect ratio Inset will depend on the scale. Note for example the difference in scaling behaviour between István's solution and kguler's solution at small sizes: in kguler's solution (using a cell aspect ratio matching that of the colour bar) the colourbar suddenly get shrunk compared to the main plot at small sizes, but the tick marks will never overlap with the other plot. in István's solution (which uses overlapping square cells) the colour bar never gets overshrunk, but the tick marks will overlap the main plot.
Update: Version 9 has built-in support for plot legends, including colour bars. Legended is used to append a legend to a graphics object.


Gridrather thanGraphicsRow/GraphicsGrid? The sizings are not fixed to be equal withGrid. – Verbeia Feb 20 '12 at 20:12Gridis the most workable solution. The inconvenience is that it's not resizable. I need to specify the size of the grid elements instead. I am making all my figures to size, and I don't resize the final result in LaTeX because I want the font sizes to be consistent. Resizing in Mathematica does not alter font sizes, but resizing an exporting PDF does. That said, I am going with Grid, as R.M. suggested. I don't think there is any other usable option. (I actually manged to tweak the cell sizes inGraphicsRow, but it introduced other problems.) – Szabolcs Feb 20 '12 at 20:32ItemSizeoption toGrid? Let me see if I can come up with an answer quickly before work beckons. – Verbeia Feb 20 '12 at 20:41Grid,ItemSizeis not even necessary because it the cells will auto-size to the content. – Szabolcs Feb 20 '12 at 21:16ImageSizeon thecolorbaris not conformable to the other plot (which it isn't by default on my screen). Yes, you can use R.M.'s answer usingShow, but in case there are situations where you don't want to useShow, this works. See the edit to my answer. – Verbeia Feb 20 '12 at 21:22PlotLegendsfor this! http://www.wolfram.com/mathematica/new-in-9/legends/ and specifically http://www.wolfram.com/mathematica/new-in-9/legends/show-gradient-for-a-density.html – dr.blochwave May 14 '14 at 17:33FrameTickshas changed. Now (at least since version 11) the syntax to produce the above bar label isFrameTicks -> {{Automatic, None}, {None, None}}. – Felix Dec 06 '16 at 23:48