(It's interesting I asked a similar question before. As your question is a superset of mine, I would like to post the answer here.)
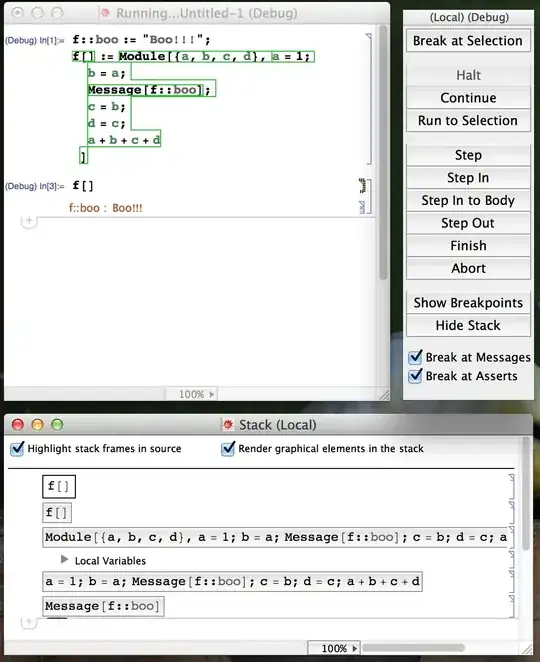
About the first question: How does the debugger know what to highlight? I don't really know the internal mechanism, but I hope this answer can provide some possible tiny clues.
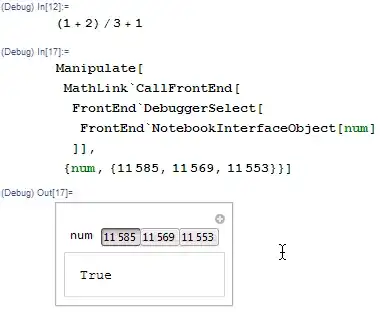
About the second question: Can we influence this somehow? In the following text, I will try to simulate the highlighter of the built-in Debugger by somehow hacky way.
Preparation
Some critical built-in functions we are going to use:
FrontEnd`NotebookInterfaceObject, FrontEnd`DebuggerSelect
Those functions can by found when checking the Stack[_] during Debugger breaks. The FrontEnd`NotebookInterfaceObject, I guess, is a kind of FrontEnd objects associated with (nearly) all expressions separately.
e.g. (1 + 2)/3 + 1 :
1 + 2 <--> NotebookInterfaceObject[1]
(1 + 2)/3 <--> NotebookInterfaceObject[2]
(1 + 2)/3 + 1 <--> NotebookInterfaceObject[3]
- Sidenote: It seems
FrontEnd`DebuggerSelect is available only when Debugger is enabled, but there is another function FrontEnd`SelectObject which seems always usable.
DebugTag
Although by using NotebookInterfaceObject, we can refer to any expression displayed in the FrontEnd, the problem is how we can FIND the corresponding object identity numbers.
I only found a partial solution really by accident.
With Debugger enabled, we set $PreRead as
$PreRead = (Print[#]; #) &
Then we evaluate the above example
(1 + 2)/3 + 1
RowBox[{
 TagBox[RowBox[{
    TagBox[RowBox[{"(",
       TagBox[
        RowBox[{"1", "+", "2"}],
        DebugTag[22769]],
       ")"}],
     DebugTag[22753]],
    "/", "3"}],
  DebugTag[22737]],
 "+", "1"}]
Note the numbers in DebugTags. Using the FrontEnd`DebuggerSelect function, it's not hard to verify that those numbers are exactly the object identity numbers of the box expressions in the corresponding TagBox.
Sidenote: The following experiment might reveal more details about DebugTag and NotebookInterfaceObject.
With Debugger enabled and $PreRead set as above, type 1 + 1/2 somewhere in an Input cell, select the cell and trigger Convert To InputForm (or any other Form. For InputForm it's Shift+Ctrl+I in Windows). It can be seen that every time we trigger the convert, a different set of identify numbers are sent to DebugTag then $PreRead.
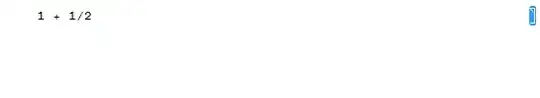
So I guess, the NotebookInterfaceObjects are allocated when an expression is rendered in FrontEnd, and Debugger somehow interrupts this process and adds the DebugTags. All of this happen in FrontEnd, before anything is passed to $PreRead.
Defination Highlighter
This section we use the functions described in Preparation to simulate the highlighter of the built-in Debugger, with full control about how and what to highlight.
The basic idea is to use Debugger to parse the input, then to intercept the DebugTaged expression at $PreRead and modify it so highlight actions are injected at every level whenever a DebugTag present, then to pass it to $SyntaxHandler, $Pre, etc. for standard evaluation.
boxHighlighter
boxHighlighter is used to perform the highlight action.
Clear[boxHighlighter]
boxHighlighter[num_, time_: 1] :=
 Block[{},
  MathLink`CallFrontEnd[
   FrontEnd`DebuggerSelect[FrontEnd`NotebookInterfaceObject[num]]];
  Pause[time]]
highlightScanWrapper
highlightScanWrapper is used to inject boxHighlighter into every expression level with the help of TraceScan.
Clear[highlightScanWrapper]
highlightScanWrapper[def_, time_] :=
 RowBox[{"TraceScan", "[",
   RowBox[{
     RowBox[{RowBox[{"(",
         RowBox[{
           RowBox[{
             RowBox[{RowBox[{"boxHighlighter", "[",
                 RowBox[{"#", ",", ToString[time]}], "]"}], "&"}],
             "@@",
             RowBox[{"ReleaseHold", "[", "#", "]"}]
             }], ";",
           "#"}],
         ")"}], "&"}], ",",
     def, ",",
     RowBox[{"dtnum", "[", "_", "]"}]
     }],
   "]"}]
dtTagTransformation
dtTagTransformation is used to perform transformation from TagBox[expr_,DebugTag[num_]] to CompoundExpression like (dtnum[num]; expr).
Clear[dtTagTransformation]
dtTagTransformation[def_] := def //.
 (* Strip out TagBox around Sequences and Lists
    to prevent syntax error like If[a, b] -> If[(dtnum[];a, b)]: *)
    TagBox[RowBox[{a : (PatternSequence[_, ","] ..), b_}], DebugTag[_]] :>
           RowBox[{a, b}] //.
    TagBox[RowBox[{"{", contents___, "}"}], DebugTag[_]] :>
           RowBox[{"{", contents, "}"}] //.
 (* Transformation rule for others: *)
    TagBox[expr_, DebugTag[dtnum_]] :>
           RowBox[{"(",
             RowBox[{
               RowBox[{"dtnum", "[", ToString[dtnum], "]"}], ";",
               expr
               }], ")"}]
parse enviroment
We use parseBegin[time] to establish the defination tracing and highlighting environment, where the time argument is used to specify how long should the highlighter pause at any highlighting. The default value is 1 second.
When entering the parse enviroment, defination performed by any member of defSymbolSet will be parsed.
defSymbolSet = {":=", "=", "^:=", "^=", ":>", "\[RuleDelayed]", "->", "\[Rule]"};

Clear[parseBegin, parseEnd, parseExit]
parseBegin[time_: 1] :=
 Block[{$highlightFunc},
  CurrentValue[$FrontEnd, {"DebuggerSettings", "ShowTools"}] = False;
  CurrentValue[$FrontEnd, {"DebuggerSettings", "ShowBreakpoints"}] = False;
  CurrentValue[$FrontEnd, {"DebuggerSettings", "ShowStack"}] = False;
  CurrentValue[$FrontEnd, {"DebuggerSettings", "BreakOnAllMessages"}] = False;
  CurrentValue[$FrontEnd, {"DebuggerSettings", "BreakOnAsserts"}] = False;
  CurrentValue[$FrontEnd, {"DebuggerSettings", "DebuggerEnabled"}] = True;
  $PreRead = (
    If[MatchQ[#, RowBox[{"parseEnd" | "parseExit", "[", "]"}]],
             $PreRead =.; #,
         # //. RowBox[{
              TagBox[funcPtn_, DebugTag[fdtnum_]],
              defSymbol_ /; MemberQ[defSymbolSet, defSymbol],
              def_}] :>
            RowBox[{
              funcPtn //. TagBox[expr_, DebugTag[_]] :> expr,
              defSymbol,
              $highlightFunc@TagBox[def, DebugTag[fdtnum]]
              }] /.
          $highlightFunc ->
               (highlightScanWrapper[dtTagTransformation[#], time] &)
              ] &);
  Null]

parseEnd[] := Null

parseExit[] :=
 Block[{},
  CurrentValue[$FrontEnd, {"DebuggerSettings", "DebuggerEnabled"}] = False;
  CurrentValue[$FrontEnd, {"DebuggerSettings", "ShowTools"}] = True;
  Null]
Usage Example
Clear[testFunc]
parseBegin[.2]
The actual defination code need to be input in a new cell (I believe this inconvenience can be fixed):
testFunc[x_ /; x < 1] := Module[{a, b, c},
  b := a + Cos[x];
  a := Sin[x];
  c = a + b;
  c + x
  ]

testFunc[x_ /; x > 1] := If[x < 1, testFunc[x], testFunc[x/2]]

DownValues[testFunc] = Join[DownValues[testFunc],
   {
    HoldPattern[testFunc[1]] :> testFunc[RandomReal[{0, 2}]]
    }];
(cell break)
parseEnd[]
Now we test this testFunc function:
testFunc[2]

parseExit[]

Dialog[]on break, so you can evaluate anything and examine the kernel state in detail. – Szabolcs Mar 05 '13 at 17:50DownValues, the debugger suddenly start highlighting, and I wonder how I can make use of this – Szabolcs Mar 05 '13 at 18:23