2

Is there a way to change my bar chart's Y-axis from powers of 10 to "billions of dollars"? For example $100,000,000,000 should read as $100B instead of 1 x 10^11 of dollars.

BarChart[<|"Bridgewater AUM" ->$ 1 10^11,"Softbank Vision Fund" -> $ 1 10^11|>, Frame->True, PlotLabel->"Assets Under Management", FrameLabel->Automatic, ChartLabels->Automatic, ImageSize->700, TargetUnits->"Dollars"]

enter image description here

George
  • 3,145
  • 7
  • 21

3 Answers3

3

Consider using Charting`FindTicks to avoid manually specifying the plot range.

billionticks = 
  Map[ Replace[{n_, lbl_} :> {n, If[n == 0, 0, Row[{"$", lbl/1*^9, "B"}]]}] ] @* 
    Charting`FindTicks[{0, 1}, {0, 1}];

BarChart[<|"Bridgewater AUM" -> 1 10^11, "Softbank Vision Fund" -> 1 10^11|>, 
 Frame -> True, FrameTicks -> {{billionticks, Automatic}, Automatic}, 
 PlotLabel -> "Assets Under Management", FrameLabel -> Automatic, 
 ChartLabels -> Automatic, ImageSize -> 400, TargetUnits -> "Dollars"]

enter image description here

Related: About the number format in ticks

Mr.Wizard
  • 271,378
  • 34
  • 587
  • 1,371
2

You may use the Units & Quantities metric conversions.

The quantity system understands metric prefixes, for example "Centi" and "Mega". Therefore you can use TargetUnits if you have Quantity objects for it to convert.

A billion in metric prefix is a "Giga". Either the unitless quantity "Unities" or a specific currency like "USDollars" can be used.

Let

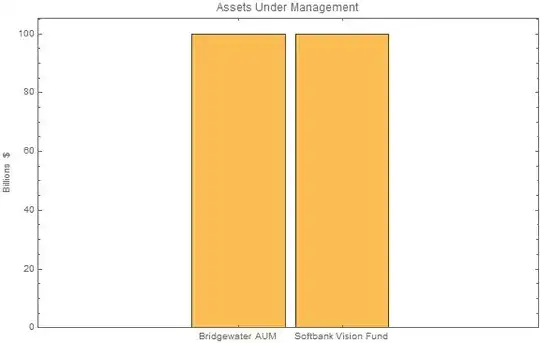
aum =  <|"Bridgewater AUM" -> 1 10^11, "Softbank Vision Fund" -> 1 10^11|>;

Then with "Unities"

BarChart[Quantity[aum, "Unities"],
 Frame -> True, 
 PlotLabel -> "Assets Under Management",
 FrameLabel -> {Automatic, "Billions $"},
 ChartLabels -> Automatic,
 ImageSize -> 700,
 TargetUnits -> "Giga"]

and with currency "USDollars"

BarChart[Quantity[aum, "USDollars"],
 Frame -> True, 
 PlotLabel -> "Assets Under Management",
 FrameLabel -> {Automatic, "Billions $"},
 ChartLabels -> Automatic,
 ImageSize -> 700,
 TargetUnits -> "Giga*USDollars"]

Both produce the following chart.

Mathematica graphics

Hope this helps.

PS: You can also us syntax like "Giga" "USDollars" or "Giga"*"USDollars" instead of all in on string.

Edmund
  • 42,267
  • 3
  • 51
  • 143
1
yTicks = {#*10^10, If[Mod[#, 2] == 0, "$" <> ToString[10 #] <> "B", ""]} &/@ Range[0, 10, 2];

BarChart[<|"Bridgewater AUM" -> 1 10^11, "Softbank Vision Fund" -> 1 10^11|>, Frame -> True, 
PlotLabel -> "Assets Under Management", FrameLabel -> Automatic,
 FrameTicks -> {{yTicks, Automatic}, {Automatic, Automatic}}, 
 ChartLabels -> Automatic, ImageSize -> 700, TargetUnits -> "Dollars"]

To get the small ticks you can adjust the stepsize in Range the way you prefer.

ctrl
  • 123
  • 1
  • 5