11

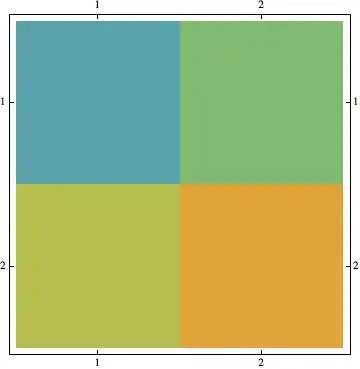
In matrix visualization, for instance,

MatrixPlot[{{1, 2}, {3, 4}}, PlotRangePadding -> 0, 
 ColorFunction -> "Rainbow"]

matrix

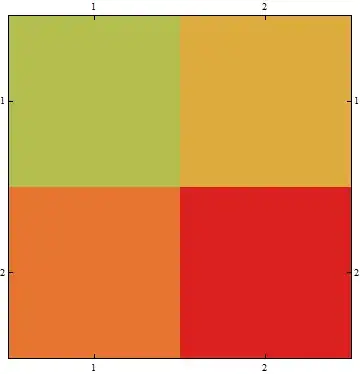
the color map does not cover the whole color range as shown in the following density plot.

DensityPlot[x, {x, 1, 4}, {y, 0, 0.1}, AspectRatio -> 0.2, 
 PlotRangePadding -> 0, ColorFunction -> "Rainbow", Frame -> True, 
 FrameTicks -> None]

color bar

I need to add the density plot as a color bar, while not using the Legend. So, how to solve this problem?

VividD
  • 3,660
  • 4
  • 26
  • 42
Tony Dong
  • 869
  • 9
  • 16

3 Answers3

8

Perhaps this question is more about understanding why it doesn't give the expected output, which Sjoerd answers, but pragmatically why not use ArrayPlot?:

ArrayPlot[
 {{1, 2}, {3, 4}},
 PlotRangePadding -> 0,
 ColorFunction -> "Rainbow", 
 FrameTicks -> All
]

Mathematica graphics

Mr.Wizard
  • 271,378
  • 34
  • 587
  • 1,371
  • Great! I had a related (but more complicated) problem with MatrixPlot and ArrayPlot solved everything at once, without having to do rescaling of the data and the bar legend. Even the bar legend default values are decimals and not fractions as in MatrixPlot. – Santiago Aug 02 '14 at 14:33
  • @Santi I'm you found this helpful. :-) – Mr.Wizard Aug 02 '14 at 18:41
7

The cause of your problem is mentioned in the details section of the MatrixPlot doc page:

With the default setting ColorFunctionScaling->True, scaling is done based on a mixture of relative value and ranking for each matrix element. The final scaled value always lies between 0 and 1, with scaled value 0.5 corresponding to matrix element value 0.

So, you don't get a linear scaling based on the matrix elements values. To get that you have to rescale yourself:

MatrixPlot[{{1, 2}, {3, 4}}, 
  PlotRangePadding -> 0, 
  ColorFunction -> (ColorData["Rainbow"][Rescale[#, {1, 4}, {0, 1}]] &), 
  ColorFunctionScaling -> False
]

Mathematica graphics

Sjoerd C. de Vries
  • 65,815
  • 14
  • 188
  • 323
2

Would something like this satisfy you?

MatrixPlot[{{1, 2}, {3, 4}}, 
ColorFunction -> Function[x, ColorData["Rainbow"][(x - 0.3)*1.1]], 
PlotRange -> All]

Mathematica graphics

chris
  • 22,860
  • 5
  • 60
  • 149