2

I have the following data:

TableA = {{5.72, 5.81, 1.13}, {4.81, 5.25, 0.86}, {4.31, 2.88, 
0.73}, {3.98, 2.38, 0.71}, {3.81, 2.33, 0.84}, {2.37, 0.97, 0.74}};
TableB = {{20.2, 5.91, 2.00}, {15.0, 4.37, 1.41}, {12.1, 3.14, 
1.13}, {10.2, 2.59, 1.02}, {9.19, 2.29, 1.08}, {4.90, 1.22, 
0.88}};

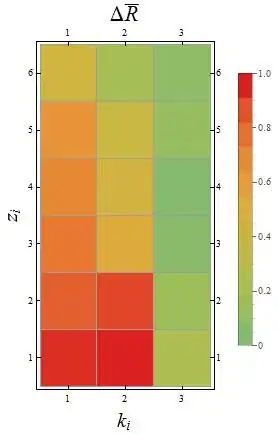
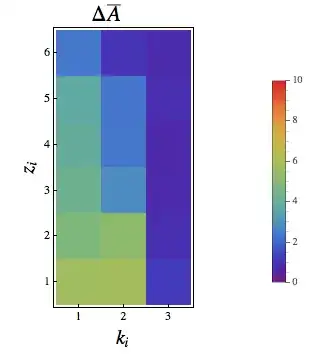
And I want to create a MatrixPlot of these:

PlotA3k = 
MatrixPlot[TableA, 
FrameLabel -> {Style["\!\(\*SubscriptBox[\(z\), \(i\)]\)", 20], 
 Style["\!\(\*SubscriptBox[\(k\), \(i\)]\)", 20]}, 
PlotLabel -> 
Style["\[CapitalDelta]\!\(\*OverscriptBox[\(A\), \(_\)]\)", 22], 
LabelStyle -> Directive[12], 
PlotLegends -> Placed[BarLegend[Automatic], {After, Center}], 
ColorFunction -> "Rainbow", 
FrameTicks -> {{1, 2, 3, 4, 5, 6, 7, 8}, {1, 2, 3}}, 
DataReversed -> {True, False}];
PlotR3k = 
MatrixPlot[TableB, 
FrameLabel -> {Style["\!\(\*SubscriptBox[\(z\), \(i\)]\)", 20], 
 Style["\!\(\*SubscriptBox[\(k\), \(i\)]\)", 20]}, 
PlotLabel -> 
Style["\[CapitalDelta]\!\(\*OverscriptBox[\(R\), \(_\)]\)", 22], 
LabelStyle -> Directive[12], 
PlotLegends -> Placed[BarLegend[Automatic], {After, Center}], 
ColorFunction -> "Rainbow", 
FrameTicks -> {{1, 2, 3, 4, 5, 6, 7, 8}, {1, 2, 3}}, 
DataReversed -> {True, False}];

I have problems with the numbers in the BarLegend.

matrix plots

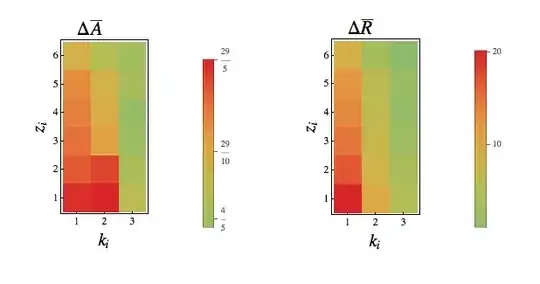
I want to have kind of percentage bar, running from the lowest to the maximum value of the data. Also I notice that numbers doesn't appear as decimals.

VividD
  • 3,660
  • 4
  • 26
  • 42

2 Answers2

2

You could also try this approach:

MatrixPlot[Rescale@TableA, DataReversed -> {True, False}, Mesh -> All,
  ColorFunctionScaling -> True, ColorFunction -> "Rainbow", 
  PlotLegends -> BarLegend[{"Rainbow", {.5, 1}}, 10, LegendMarkerSize -> 300], 
  PlotLabel -> Style["\[CapitalDelta]\!\(\*OverscriptBox[\(R\), \(_\)]\)", 22], 
  FrameLabel -> {Style["\!\(\*SubscriptBox[\(z\), \(i\)]\)", 20], 
  Style["\!\(\*SubscriptBox[\(k\), \(i\)]\)", 20]}]]

Result:

enter image description here

You could also use another color function, for instance, "TemperatureMap":

enter image description here

Rod
  • 3,318
  • 2
  • 24
  • 40
  • I thought he wanted his {1,1} square to be legended as 5.72 - but your scale only goes up to 1...? – cormullion Jul 17 '13 at 21:08
  • @cormullion I use Rescale[] to convert the data for plotting purposes. That's why the scale goes from 0 to 1. – Rod Jul 18 '13 at 00:01
1

Perhaps this is what you're looking for:

PlotA3k = 
 Legended[MatrixPlot[TableA, 
   FrameLabel -> {Style["\!\(\*SubscriptBox[\(z\), \(i\)]\)", 20], 
     Style["\!\(\*SubscriptBox[\(k\), \(i\)]\)", 20]}, 
   PlotLabel -> 
    Style["\[CapitalDelta]\!\(\*OverscriptBox[\(A\), \(_\)]\)", 22],
   LabelStyle -> Directive[12],
   ColorFunctionScaling -> False,
   ColorFunction -> (ColorData["Rainbow"][
       Rescale[#, {0, 10}, {0, 1}]] &),
   FrameTicks -> {{1, 2, 3, 4, 5, 6, 7, 8}, {1, 2, 3}},
   DataReversed -> {True, False}],
  Placed[
   BarLegend[{"Rainbow", {0, 10}},
    LegendLayout -> "Column",
    LegendMargins -> 0],
   {After, Center}]]

matrixplot

This question also suggests that the default number format is 'fractions'. So:

MatrixPlot[RandomReal[1, {2, 2}], PlotLegends -> Automatic]

basic matrix plot

cormullion
  • 24,243
  • 4
  • 64
  • 133
  • @AlejandroGuarnizo that's why I think you should use {0,10} rather than Automatic. – cormullion Jul 17 '13 at 18:48
  • I almost got it..but I'm wondering how I can control the automatic scale. I mean..since for example in TableB the largest value is about 22..how I can "say" that the LegendBar goes from zero to that value? – Alejandro Guarnizo Jul 17 '13 at 18:50
  • @AlejandroGuarnizo In my answer the legend and the plot are both using {0, 10} to control how the colours are allocated. With {0,10} there are no reds or oranges because there are no values in TableA above 5.8. Use {0,25} if you want. – cormullion Jul 18 '13 at 07:36
  • Thank you so much @cormullion I got it!!! – Alejandro Guarnizo Jul 18 '13 at 12:07
  • @AlejandroGuarnizo Cool. Explanations are found in the linked posts. (Thanks for the Accept!) – cormullion Jul 18 '13 at 12:16