Edit
In reply to your comment above, if you want to get the values (images) of all your polynomials at a large number of values of x, then something like this will be fastest:
y = polynomials.(x^# & /@ {3, 2, 1})
If you want to only plot the polynomials, then use Plot, not ListPlot, and the formulas for the polynomials. Each of the three current answers has way (@bill s, @belisarius, and mine). I think you would be the best judge of which has the greatest ease of understanding. I don't think to get the formulas, process speed matters much until you have lots of polynomials.
Original
Here's function that takes a list of coefficients (edit now assuming no constant term) and returns a polynomial function:
polyFn[coeff_List] := Function[{x}, Evaluate@Fold[x (#2 + #1) &, 0, coeff]]
Example:
polyFn[{a, b, c}][x]
(* x (c + x (b + a x)) *)
The function polyFn[{a, b, c}] can be evaluated at many points in one call and it will take advantage of the built-in vectorized functions Plus and Times automatically:
polyFn[{a, b, c}][{1, 2, 3}] // Expand
(* {a + b + c, 8 a + 4 b + 2 c, 27 a + 9 b + 3 c} *)
Ten random coefficents for ten polynomials:
polys = RandomReal[{-1, 1}, {10, 3}];
polynomials = polyFn /@ polys

(* {Function[{x$}, x$ (0.682011 + (0.64716 + 0.179604 x$) x$)],
Function[{x$}, x$ (0.327702 + (0.417207 + 0.832486 x$) x$)],
    ... omitted ...
Function[{x$}, x$ (0.684578 + (0.196256 + 0.159777 x$) x$)]} *)
And evaluate them all on the same set of inputs:
images = Through[polynomials[Range[0., 2, 0.1]]];
Through takes each function in the list polynomials and applies to Range[..].
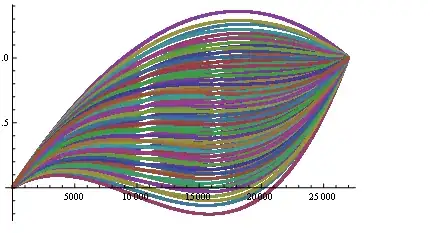
Voilà:
ListLinePlot[images]

I am accustomed to polynomials being represented with the coefficients in the other order, from constant to higher degree, so that the index in the list corresponds to the degree of the term (off by one if one starts with a constant term). The correspondence can be convenient, but then one has to change polyFn:
polyFn[coeff_List] := Function[{x}, Evaluate@Fold[#2 + x #1 &, 0, Reverse@coeff]]
Both versions handle arbitrarily long lists of coefficients (i.e., arbitarily high degree polynomials).
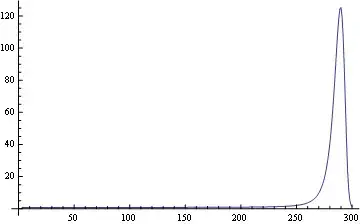
And of course you can use Plot with them, as @bill suggests. Use
Plot[Evaluate[Through[polynomials[x]]], {x, 0, 2}]

y[f_] := (f.#^{3, 2, 1} &) /@ x;
ListLinePlot[Evaluate[y /@ polynomials], Frame -> True, Axes -> False, ImageSize -> 500]
– Samuel Siqueira Mar 15 '13 at 14:51(my comment/question above)
– Samuel Siqueira Mar 15 '13 at 14:52(my comment/question above)
– Samuel Siqueira Mar 15 '13 at 14:53(my comment/question above)
– Samuel Siqueira Mar 15 '13 at 14:54