I have this Mathematica code
Clear[colorbar]
colorbar[{min_, max_}, colorFunction_: Automatic, divs_: 150] :=
DensityPlot[y, {x, 0, 0.1}, {y, min, max}, AspectRatio -> 10,
PlotRangePadding -> 0, PlotPoints -> {2, divs}, MaxRecursion -> 0,
Frame -> True,
FrameLabel -> {{None, Subscript["R", "min"]}, {None, None}},
LabelStyle -> Directive[FontFamily -> "Helvetica", 17],
FrameTicks -> {{None, All}, {None, None}},
FrameTicksStyle -> Directive[FontFamily -> "Helvetica", 15, Plain],
ColorFunction -> colorFunction]
Mn = 250; cn = 0.25;
Md = 7000; b = 6; a = 3; h = 0.2;
υ0 = 20; β = 1.5; ch = 8.5;
Lz = 10;
E0 = 600;
Vn = -Mn/Sqrt[R^2 + z^2 + cn^2];
Vd = -Md/Sqrt[b^2 + R^2 + (a + Sqrt[h^2 + z^2])^2];
Vh = υ0^2/2 Log[R^2 + β*z^2 + ch^2];
Vt = Vn + Vd + Vh;
Veff = Vt + Lz^2/(2*R^2);
f[R_, pR_] := 1/2*pR^2 + Veff /. {z -> 0};
plrange = {{0, 13.5}, {0, 47}};
valrange = {0, 6};
C0 =
ContourPlot[Evaluate[f[R, pR]], {R, 0.001, 15}, {pR, 0, 50},
Contours -> {E0}, ContourStyle -> {{Black, Thickness[0.005]}},
AspectRatio -> 1, ContourShading -> False, PlotPoints -> 200,
PerformanceGoal -> "Speed", PlotRange -> plrange];
With[{opts = {ImageSize -> {Automatic, 550}}, cf = "Rainbow"},
Row[{Show[
ListPlot[List /@ data[[All, {1, 2}]],
PlotStyle -> ({PointSize[0.01], ColorData[cf][1 - #]} & /@
Rescale[data[[All, 3]], valrange]),
PlotRange -> plrange,
AspectRatio -> 1, Frame -> True, RotateLabel -> False,
Axes -> None, FrameTicks -> True,
FrameLabel -> {"R", OverDot["R"]},
LabelStyle -> Directive[FontFamily -> "Helvetica", 17],
ImagePadding -> {{60, 20}, {60, 20}}, opts],
C0],
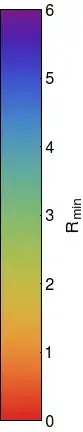
Show[colorbar[valrange, cf],
ImagePadding -> {{20, 60}, {60, 20}}, opts]}]]
I inverted the "Rainbow" color scheme using
{..., ColorData[cf][1 - #]}&
and produced the following nice plot.

However, I can't find a way to invert the colors in the color bar. To be more specific, according to my data red should correspond to 0 of Rmin and deep purple to 6. I hope it is easy to invert the order of the colors in the color bar. Can someone tell me how?
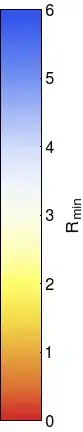

colorbar[valrange, cf]withcolorbar[valrange, ColorData[cf][1 - #] &]at the end of your example. – VLC Mar 18 '13 at 11:42