8

I had a more general question about a similar problem more than two years ago, Getting rid of discontinuities in plots caused by square roots, logarithms, `Arg`, etc, which got lots of interesting feedback but no definite answer.

So I decided to focus on something more obviously urgent and simple.

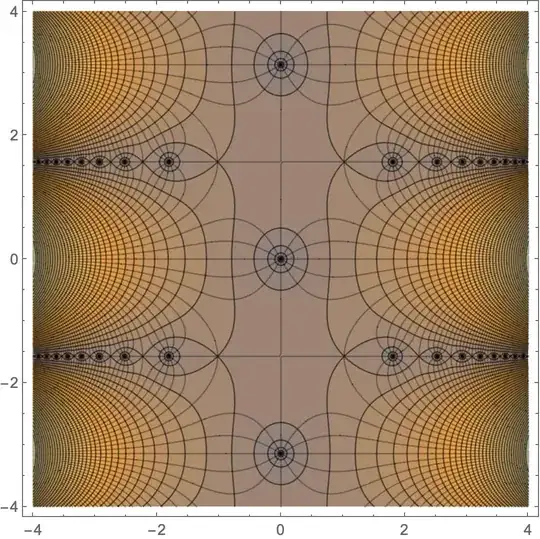
Here is the result of

ContourPlot[Log[Abs[Sinh[Sinh[x+I y]]]],{x,-4,4},{y,-4,4},
 MeshFunctions->{Arg[Sinh[Sinh[#1+I #2]]]&},
 Mesh->11,PlotPoints->150,Contours->50]

enter image description here

I guess I don't even need to ask: I want to get rid of those rough thick black lines, that's all.

PS Heard rumours that it might be incorporated in version 12. I have 11.0.1.0, but still, let me know if this is the case.
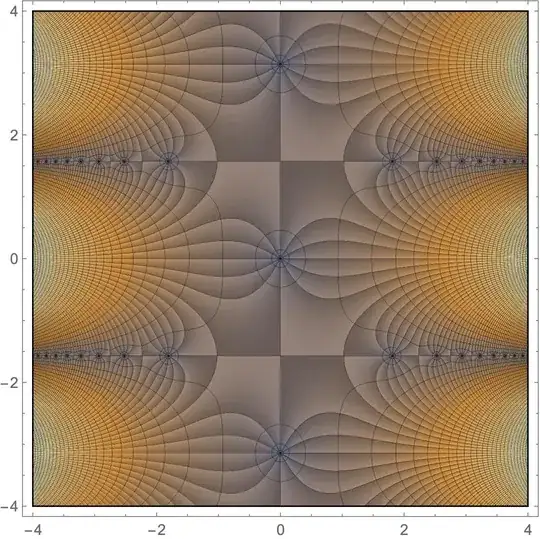
J. M.'s missing motivation
  • 124,525
  • 11
  • 401
  • 574

1 Answers1

11

The problem is the discontinuity in Arg. One way to correct it is to apply a continuous periodic function (of period $2\pi$) to it. I used TriangleWave so that the differences between mesh lines would remain the same.

ContourPlot[Log[Abs[Sinh[Sinh[x + I y]]]],
 {x, -4, 4}, {y, -4, 4},
 MeshFunctions -> {TriangleWave[
     Arg[Sinh[Sinh[#1 + I #2]]]/(2 Pi) - 1/24] &}, 
 Mesh -> {1/6 + Range[-3, 2]/3},
 PlotPoints -> 201, Contours -> 50]

Alternative

This takes a bit longer for a high-quality plot, but it shows the Arg[] nicely. A bit hard to figure out how to scale the ColorFunction, too.

ComplexPlot[Sinh[Sinh[z]], {z, -4 - 4 I, 4 + 4 I},
 PlotPoints -> 801, Mesh -> {51, 1/6 + Range[-3, 2]/3}, 
 MeshFunctions -> {Log@Abs[#2] &, 
   TriangleWave[Arg[#2]/(2 Pi) - 1/24] &},
 MeshStyle -> Directive[Thin, GrayLevel[0.]],
 ColorFunction -> {(Evaluate@
      ColorData["M10DefaultDensityGradient"][
       0.5 + Clip[Log[#7] - 6, {-15, 15}]/30] &), "CyclicArg"}, 
 ColorFunctionScaling -> False, RasterSize -> 1000]
Michael E2
  • 235,386
  • 17
  • 334
  • 747