I have a function that is defined on a specific domain for example the function $$f(x,y)=(x-0.5)*(y-0.5)$$ defined on $\Sigma$ which is the circle $(x-0.5)^2+(y-0.5)^2=0.5^2$
How to plot $f$ over $\Sigma$?
I tried something like
Plot3D[(-0.5 + x) (-0.5 + y), {x, -1, 1}, {y, -1, 1},
RegionFunction ->
Function[{x, y}, 0.5^2 - 0.01 <= (x - 0.5)^2 + (y - 0.5)^2 <= 0.5^2 + 0.01]]
but I am looking for something better.
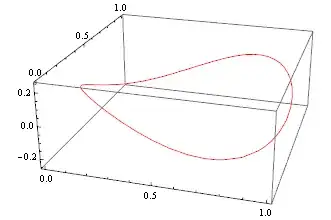
ParametricPlot3D[]? – J. M.'s missing motivation Apr 25 '13 at 17:11PlotPoints -> 100the results is quite nice I think. – b.gates.you.know.what Apr 25 '13 at 17:18PlotPoints->100seems to solve this. However it essentially gives a band around the solution, defined a parameter (in this case 0.01). Changing the parameter leads again to problems. So I am looking for a more natural way to solve this. – Jim Apr 25 '13 at 17:37ParametricPlot3D[{1/2 Cos[t], 1/2 Sin[t], (-1/2 + 1/2 Cos[t]) (-1/2 + 1/2 Sin[t])}, {t, 0, 2 Pi}]. – b.gates.you.know.what Apr 25 '13 at 17:55