4

I am trying to find a fitting function for a multidimensional set of data. I will have to find a fitting function that is always lower (conservative) than the data fitted.

The easiest way is to look for the largest underestimation and add this value to the fit function. But this does not lead to very good fits. I have illustrated this in the following using some random data:

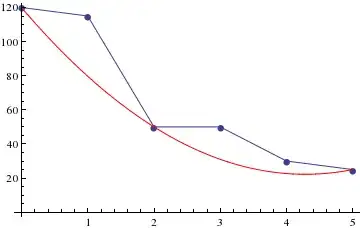
test = {{0.0, 120.0}, {1, 115}, {2, 50}, {3, 50}, {4, 30}, {5, 25}};
function[x_] := a + b x + c x^2;
rep = FindFit[test, function[x], {a, b, c}, {x}]
delta = (test - 
    Table[{x, function[x]} /. rep, {x, 0, 5, 1}])[[All, 2]];
Show[
 ListLinePlot[test, PlotMarkers -> Automatic, AxesOrigin -> {0, 0}],
 Plot[function[x] /. rep, {x, 0, 5}, PlotStyle -> Red],
 Plot[(function[x] /. rep) + Min[delta], {x, 0, 5}, 
  PlotStyle -> Green]
 ]

plots of fitted functions

Red is best fit, Green is shifted fit (no longer a good fit).

If I understood correctly I will have to change the norm. But I do not how such a norm could look like and how to implement it. To me it seems like some kind of penalty method could be implemented in the norm.

Thank you very much for your answers and hints!

J. M.'s missing motivation
  • 124,525
  • 11
  • 401
  • 574
Philipp
  • 641
  • 3
  • 8
  • You might choose to use NonlinearModelFit[], have it return confidence intervals for your parameters for some set confidence level, and take the low ends of those intervals. – J. M.'s missing motivation May 03 '13 at 11:13
  • Based on your description, I wonder if you are trying to find the envelope of a set of data? If so, you can have a look at this question. – xzczd May 03 '13 at 11:27
  • I am not really looking for an envelope. I am looking for a simple function that represents my data but never yields lower values as the data itself. – Philipp May 03 '13 at 12:12

2 Answers2

6

You can use constraints together with the definition of your model function :

rep2 = NonlinearModelFit[test, 
        Join[{function[x]}, function[#[[1]]] <= #[[2]] & /@ test], {a, b, c}, x];

rep2 // Normal
(* 120. - 45.6667 x + 5.33333 x^2 *)

Show[ListLinePlot[test, PlotMarkers -> Automatic, AxesOrigin -> {0, 0}],           
     Plot[rep2[x], {x, 0, 5}, PlotStyle -> Red]]

plot

b.gates.you.know.what
  • 20,103
  • 2
  • 43
  • 84
2

A simple penalty method is just to multiply the norm by some factor when the error is positive, e.g:

rep = FindFit[test, function[x], {a, b, c}, {x}, 
  NormFunction -> (Total[(20 Sign[#] + 21) #^2] &)]

enter image description here

Simon Woods
  • 84,945
  • 8
  • 175
  • 324
  • Thank you. Why 20sgn+21? How to adjust the penalty? I cant figure it out. – Philipp May 03 '13 at 12:52
  • @Philipp, n Sign[x] + n+1 gives 1 if x is negative and 2n+1 if x is positive, so the norm is multiplied by 2n+1 where the curve is above the data. It's rather crude - the method using constraints is clearly better - but I like that this ham-fisted hacking of the norm function produces a reasonable looking result. – Simon Woods May 03 '13 at 13:42