I have a function
f[x_, y_, z_] := Exp[-x^2]*Exp[-z^2]
which traces out a tube along $y$. Is there a way to plot this 4D function, where the plot color is the 4th dimension?
I think what you're after is ContourPlot3D. There are two ways to color the contours.
ColorFunction has a certain attractive automatic feature to it, but it doesn't color as nicely as ContourStyle, especially if you are coloring the surfaces by the function value. ContourStyle produces smaller graphics and is faster, too.
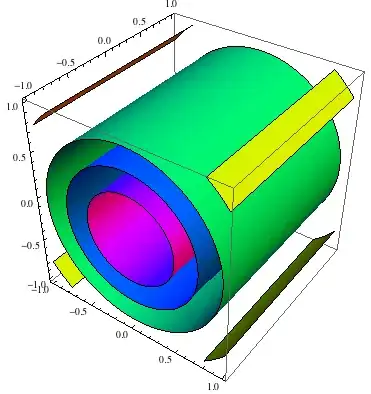
cons = {0.2, 0.4, 0.6, 0.8};
ContourPlot3D[
 Exp[-x^2]*Exp[-z^2], {x, -1, 1}, {y, -1, 1}, {z, -1, 1},
 Mesh -> None,
 Contours -> cons, ContourStyle -> Hue /@ cons]
ContourPlot3D[Exp[-x^2]*Exp[-z^2], {x, -1, 1}, {y, -1, 1}, {z, -1, 1},
  Mesh -> None, MaxRecursion -> 3,
 ColorFunction -> Function[{x, y, z, f}, Hue[f]]]

You can also diminish the Opacity of the contours; see the manual.
You can vary the color of the tube as it goes along - if you provide a list of the colours that it passes through to VertexColors:
Graphics3D[
 {CapForm["Round"],
  Tube[
   Accumulate[
    RandomReal[{-3, 3}, {50, 3}]], .3,
   VertexColors ->
    Table[RGBColor[x, 1 - x, 0.5 - x/2], {x, 0, 1, 1/50}]]
  },
 Lighting -> "Neutral",
 Background -> Gray,
 Boxed -> False]

Have I understood correctly? Look at this:
Edit: I forgot ColorFunctionScaling. Now it is ok.
RegionPlot3D[
 x^2 + z^2 <= 1, {x, -2, 2}, {y, -12, 12}, {z, -2, 2}, Mesh -> None,
 ColorFunctionScaling -> False,
 ColorFunction ->
  Function[{x, y, z}, ColorData["Rainbow"][Exp[-x^2]*Exp[-z^2]]]]

Tube-y, since circular cylinders are tubes. I was confused at first whether "tube" meantTube[..], but later I realized the contours were cylinders whose axis was the y-axis, just as in the Q. (Frankly,fdoes not trace out tubes and "the 4th dimension" is unclear. The function is not a parametrization, and "the 4th dimension" makes sense to me only if the Q is referring to the graph off, which is a 3D hypersurface in R^4. I think one has to guess at the meaning of the Q as it is stated.) – Michael E2 Jun 09 '13 at 02:52