I have a list of 4D data (x position, y position, amplitude, wavelength). I want to plot x, y, and amplitude on a 3D plot and have the color of the points correspond to the wavelength. I have seen many examples using functions to define color but my wavelength cannot be expressed by an analytic function. Is there a simple way to do this?
Asked
Active
Viewed 1.3k times
13
-
3Could you post what you have tried and maybe a sample of your data? – s0rce Feb 22 '13 at 18:20
-
Probably can find your answer here: http://mathematica.stackexchange.com/questions/6521/listplot3d-how-to-make-the-color-depending-on-a-second-list – s0rce Feb 22 '13 at 18:24
-
1another post might be helpful:http://mathematica.stackexchange.com/questions/19575/what-are-the-possible-ways-of-visualizing-a-4d-function-in-mathematica – halmir Feb 22 '13 at 18:41
2 Answers
11
Here a another possible way to visualize 4D data:
data = Flatten[Table[{x, y, x^2 + y^2, Sin[x - y]},
    {x, -Pi, Pi,Pi/10}, {y,-Pi,Pi, Pi/10}], 1];
You can use the function Point along with VertexColors. Now the points are places using the first three elements and the color is determined by the fourth. In this case I used Hue, but you can use whatever you prefer.
Graphics3D[
   Point[data[[All, 1 ;; 3]], VertexColors -> Hue /@ data[[All, 4]]],
   Axes -> True, BoxRatios -> {1, 1, 1/GoldenRatio}]
chuy
- 11,205
- 28
- 48
-
This is a good solution. I only need to figure out how to normalize the Hue (my wavelength data goes from 530 to 640) Thanks for the quick help. – J-P Feb 22 '13 at 20:04
-
You should take a look at the useful function Rescale: Graphics3D[ Point[data[[All, 1 ;; 3]], VertexColors -> Hue[Rescale[#,{530,640}]] /@ data[[All, 4]]], Axes -> True, BoxRatios -> {1, 1, 1/GoldenRatio}] – chuy Feb 22 '13 at 22:39
-
IS there a way to plot the function directly, without generating the points? – Andrei Kucharavy May 23 '14 at 05:15
-
This is great. Anyway to automatically add a legend that gives some idea to what values the colors correspond? – Kvothe May 04 '20 at 15:29
-
1@Kvothe I'm not sure if you'd count this as automatic or not, but
Legended[Graphics3D[ Point[data[[All, 1 ;; 3]], VertexColors -> Hue /@ data[[All, 4]]], Axes -> True, BoxRatios -> {1, 1, 1/GoldenRatio}], BarLegend[{Hue, MinMax@data[[All, 4]]}]]– chuy May 04 '20 at 16:07 -
8
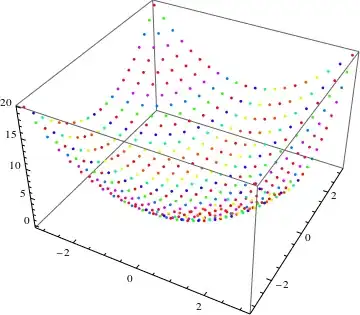
You can try the following approach. Let's first generate some 4D data:
ndata = 100;
data = Transpose[{RandomReal[{-1, 1}, ndata],
    RandomReal[{-1, 1}, ndata], RandomReal[{0, 10}, ndata],
    RandomReal[{400, 800}, ndata]}];
Now we use the first three columns as $x$, $y$ and $z$ coordinates, whereas the 4th column specifies the color of each point. The color range is specified via the Blend function that specifies that a value of 400 should correspond to Darker[Green], a value of 600 to Yellow and a value of 800 to Red. All other values are blended colors.
ListPointPlot3D[List /@ data[[All, {1, 2, 3}]],
 PlotStyle -> ({PointSize[Large],
      Blend[{{400, Darker[Green]}, {600, Yellow}, {800,
         Red}}, #1]} & /@ Flatten[data[[All, {4}]]])]

VLC
- 9,818
- 1
- 31
- 60
-
This also works. Thanks for the help. Too bad I can't select 2 answers as solution. – J-P Feb 22 '13 at 20:06