0

I have a huge list of data in the form of triplets numbers (e.g. {x,y,z}) and I want 2d plot. In which I want to plot y vs x on which values of z should be shown with color depending on the value of z for each x,y point. Means variation of z with color on x,y plot. Is it possible to show plot legend outside the plot boundaries?

Please give me suggestions

physicist
  • 101
  • 1
  • 1
  • 8

1 Answers1

2

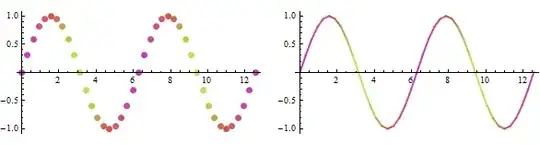
The Simplest way is to use Graphics and put the points.

dat = Table[{x, Sin[x], Cos[x]}, {x, 0., 4 \[Pi], \[Pi]/10.}]; (*trial data set*)
(*column 1 and 2 is for data and 3 is for colour*)

ndata = Length[dat];
min = Min[dat[[All, 3]]];max = Max[dat[[All, 3]]];
col = (dat[[All, 3]] - min)/(max - min);
(*to scale the colour index between 0 and 1*)

Graphics[Table[{ColorData["NeonColors"][col[[i]]], PointSize -> Large,
Point[{dat[[i, 1]], dat[[i, 2]]}]}, {i, 1, ndata}], Axes -> True, AspectRatio -> .5]

Simplified Version [courtesy Anon and belisarius]

col = Rescale[dat[[All, 3]]]; pts = dat[[All, 1 ;; 2]];
Graphics[Table[{ColorData["NeonColors"][col[[i]]], PointSize -> Large,
Point[pts[[i]]]}, {i, ndata}], Axes -> True, AspectRatio -> .5]

For drawing with Line

Graphics[Table[{ColorData["NeonColors"][col[[i]]], Thick,
Line[{pts[[i]], pts[[i + 1]]}]}, {i, ndata - 1}], Axes -> True, AspectRatio -> .5]

color plot

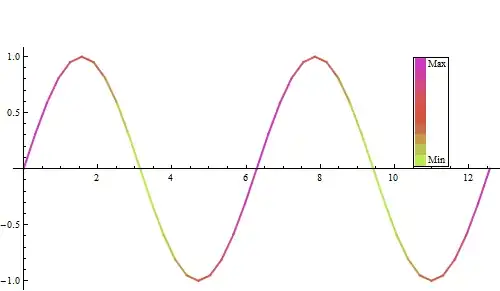
Using ColorScheme as legend

Needs["PlotLegends`"]
(*create legendbox*)
legend = Graphics[Legend[ColorData["NeonColors"][1 - #1] &, 10, " Max", " Min", 
LegendShadow -> None, LegendBorder -> Automatic]];

(*put it in inset*)
lps = {11.0, .5}; (*legend position*)
Graphics[{Table[{ColorData["NeonColors"][col[[i]]], Thick, 
Line[{pts[[i]], pts[[i + 1]]}]}, {i, ndata - 1}], 
Inset[legend, lps, Automatic, {1, 1}]},
Axes -> True, AspectRatio -> .5, ImageSize -> 500]

legend

Sumit
  • 15,912
  • 2
  • 31
  • 73
  • 1
    Take a look at Rescale[] – Dr. belisarius Jul 03 '13 at 18:29
  • 1
    I was just about to say that, (1) col = Rescale[dat[[All, 3]]];, (2) pts = dat[[All, 1 ;; 2]]; simplifies the Point to Point[pts[[i]]] and (3) {i, 1, ndata} is equivalent to {i,ndata}. But nice answer, +1. – C. E. Jul 03 '13 at 18:32
  • Thanks for suggestions but if i want join all my points then how can i include this in your given code – physicist Jul 04 '13 at 19:10
  • well @physicist, then you can chose two points at a time and use Line. – Sumit Jul 04 '13 at 20:55
  • How can i reverse the order of colors in this scheme in the code – physicist Jul 11 '13 at 07:57
  • @physicist, the first way I can think about is to use 1-col[[i]] instead of col[[i]] with ColorData["ColorScheme"]. – Sumit Jul 11 '13 at 09:13
  • Is possible to put color bar for same, outside the plot like showed in http://mathematica.stackexchange.com/questions/32844/need-4d-plot-3d-color-for-function for 4d data. But I need for 3d data with third axis represented by color. – physicist Apr 01 '14 at 16:23