I have similar question like mentioned at representing triplet data set with color on 2d plot but this time instead of color I need to represent variation of third axis with the thickness of the curve
Asked
Active
Viewed 201 times
1 Answers
1
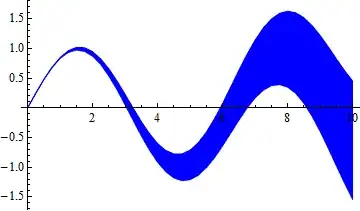
Here Filling can be a big help.
Some sample data:
data = {#, Sin[#], #^2} & /@ Range[0, 10, 1/4];
A function to help create the variable "thickness". The parameter f is like a scaling factor:
addThickness[data_, f_] :=
 Transpose[
  data /. {x_, y_, z_} :> {{x, y}, {x, y - f z}, {x, y + f z}}]
and now make the FillingStyle match the PlotStyle:
ListLinePlot[addThickness[data, 0.01],
 Filling -> {2 -> {1}, 3 -> {1}}, PlotStyle -> Blue,
 FillingStyle -> Opacity[1]]
chuy
- 11,205
- 28
- 48
-
How can I apply this method to list data like data = Table[{TL[[jj, 5]], TL[[jj, 6]], TL[[jj, 1]]}, {jj, 1, Length[TL]}]; – physicist Apr 01 '14 at 20:37
-
I have used the above code but it is not so useful because it is creating negative values of third variable which is not the part of data – physicist Apr 01 '14 at 21:39