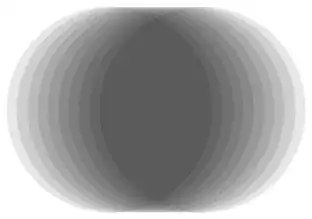
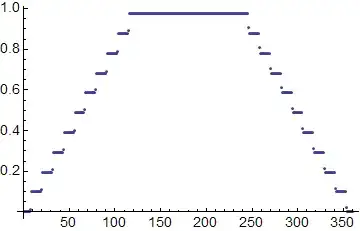
Let's say I have 100 polygons that are all different but most of them overlap. All I want to do is to draw/plot them in one single graphic with linearly adding gray values; i.e., a point with n overlapping polygons(or other graphics) should have a grayvalue of n/100.
I wish
Graphics[{Opacity[1/10], Table[Disk[{i/10, 0}], {i, 10}]}]
would work, but Opacity doesn't add up linearly, and I don't find any easy way to do what I want.
My current idea is to go via Image[Graphics[...]], ImageData and ArrayPlot, but I might lose a lot of precision that way.


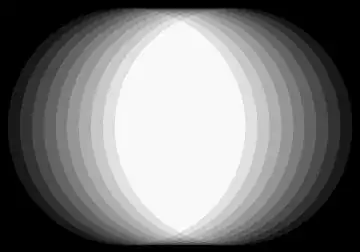
FoldwithImageAddis quite handy. If you want high precission you may try to work with inequalities which are describing polygons andPiecewiseetc. but this is going to be so slow... :) – Kuba Jul 23 '13 at 11:14