4

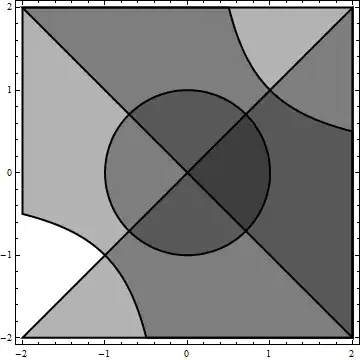
I want to plot the overlapping regions of several inequalities. For example,

RegionPlot[{x + y > 0, x - y > 0, x^2 + y^2 < 1, x y < 1}, {x, -2, 2}, {y, -2, 2}]

The regions for the inequalities can overlap twice, three times, and so on. I want to make a plot in grayscale, such that the more times they overlap, the darker the region is. Is there a way to do that?

renphysics
  • 1,560
  • 1
  • 10
  • 19

2 Answers2

9

One way:

Show[RegionPlot[#, {x, -2, 2}, {y, -2, 2}, 
     PlotStyle -> Opacity[.3]] & /@ {x + y > 0, x - y > 0,  x^2 + y^2 < 1, x y < 1}]

Mathematica graphics

Dr. belisarius
  • 115,881
  • 13
  • 203
  • 453
8

Or with one plot:

RegionPlot[{x + y > 0, x - y > 0, x^2 + y^2 < 1, x y < 1}, {x, -2, 2}, {y, -2, 2}, 
 PlotStyle -> ConstantArray[Directive[Opacity@.3, Black], 4], 
 BoundaryStyle -> Thick]

enter image description here

Kuba
  • 136,707
  • 13
  • 279
  • 740