This question is related to a previous one of mine: Partitioning a superset of coordinates into subsets that generate continuous curves, where the challenge was to partition a data set into two clusters representing distinct "semicontinuous curves" (we mean this in the loose sense that a ListPlot generated two curves that by eye appeared to be continuous). The user rm -rf illustrated and demonstrated that FindClusters could very nice solve the problem using a Euclidean distance metric (a hat tip also to g3kk0 who elaborated on this approach).
My question here is how one would approach a much more pathological case, where we have multiple closely spaced curves, displaced some amount vertically, and we would like to generate an "average" curve that represents a sort of average for the shape of all the semicontinuous curves.
Take a look at the following plots (data uploaded to: https://www.dropbox.com/sh/751invayqe3ip9b/r6raIrdvLF):
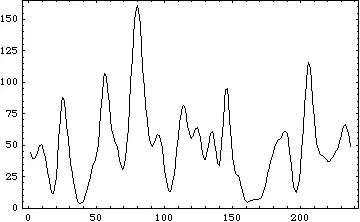
Plot A:

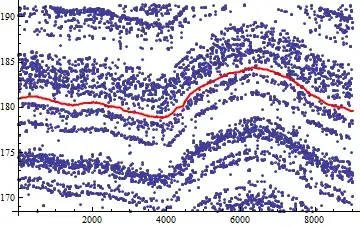
Plot B:

In both cases, we can more or less clearly make out by eye what the shape of each semicontinuous curve looks like. For example, take the following "hand drawn" traces of two semicontinuous curves in Plot B:

While it may not be possible to separate the data sets for Plot A and Plot B into clusters that represent each of these semicontinuous curves (I'd love to be corrected on this point), how can we automatically generate a sort of "average curve" that follows the trend for each of the semicontinuous curves?
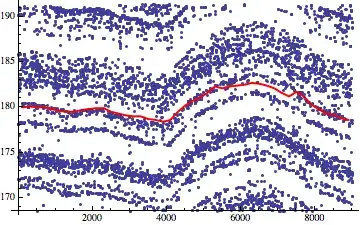
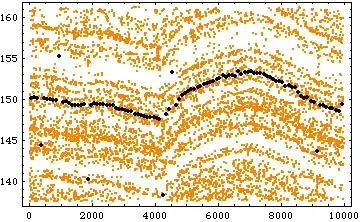
Update: In reponse to rm -rf's comment, if we take a similar data set to Plot B and bin along the X-axis and then compute a mean for each bin (computing the median generates a similar result), the resulting plot looks like this:

My explanation for this is that we cannot "see" (i.e. we do not have access to) all of the semicontinuous curves in the plot. A peak in the set of curves may cause additional curves to appear near the bottom of the plot (see the $X \approx 5000$ to $8000$ region in Plot B), and vice versa.
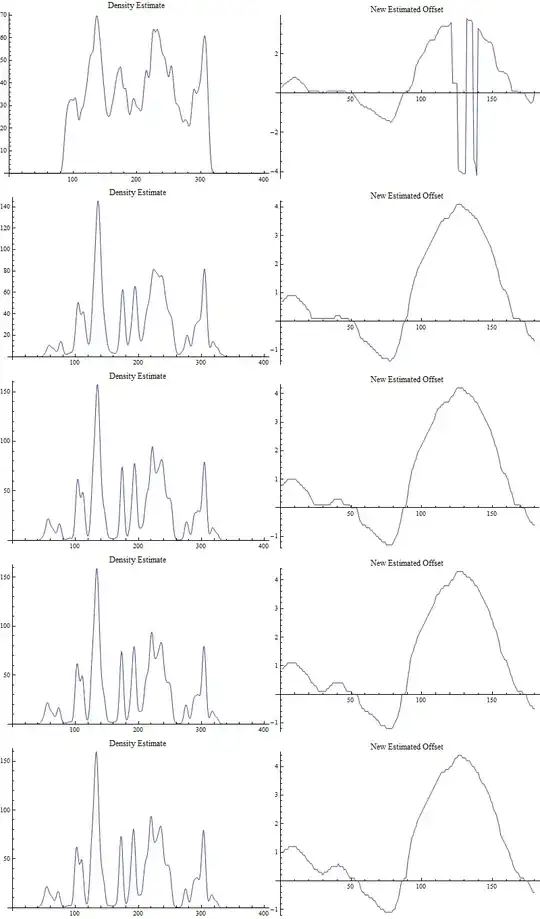
Update 2: If we connect all points within some small cutoff distance $T$ (perhaps $T = 1$ here), generating a random geometric graph, perhaps we could look at the angle of the edges connecting the points / vertices? This shouldn't be affected very much by the presence of peaks or troughs of curves at the bottom and top of the plot, respectively.
Update 3: Provided that the data here is generally periodic along the $y$-axis, it might be reasonable to treat the surface as if it it curves around on itself like a tube (where the x-axis is the long-axis of the tube, and the curvature occurs along the y-axis).


ListCorrelate. – Jul 30 '13 at 02:18