6

I have an image of a figure:

enter image description here

I want to estimate the areas of colored regions separately. If data are available, then one could apply Integrate[Interpolation[**data**, {x-range}]. Unfortunately, actual data are not available, although the figure itself is.

There are some examples in this SE, playing with images to extract the underlying data such as Filter a specific area of an image.

Any idea?

Domen
  • 23,608
  • 1
  • 27
  • 45
Tugrul Temel
  • 6,193
  • 3
  • 12
  • 32
  • 1
    Try ComponentMeasurements[image // Binarize, "Area"] but you will probably need to tinker with the Binarize to get good segmentation of the regions. I played around a bit and it may be necessary to just use a single bit plane (ImageData) since the regions may not be all the same pixel values but shaded. – OpticsMan Jan 09 '24 at 23:08
  • @OpticsMan: I run your code and got a bunch of numbers. I do not know what they represent. Some numbers are way beyond the possible range. Basically, it is very hard to make sense of the numbers. Do you know what the output refers to? – Tugrul Temel Jan 09 '24 at 23:41

2 Answers2

12

It is also worth using the Mathematica functions

enter image description here

DominantColors[gr, 3, {"Color", "Coverage","CoverageImage"}, "Dataset", MinColorDistance -> 0 ]

enter image description here

Result agrees well with RolandF's answer!

Ulrich Neumann
  • 53,729
  • 2
  • 23
  • 55
  • Good estimation, too! Very short one line. I have the same comment as the one I gave to other answer. Why does it not total to 100%? Perhaps, the the colored lines between different regions are excluded from the calculation. – Tugrul Temel Jan 10 '24 at 15:21
  • In the figure, I deliberately give the X-Y axes with numbers. Is there any way to use the X-Y axes to extract the data in the form of {(X, Y)} for the gray area and similarly for the curve associated with the green color, and the rest will be light brown. – Tugrul Temel Jan 10 '24 at 15:41
  • 1
    @TugrulTemel That means you are looking for a "digitizer"? Perhaps this link Recovering data points from an image helps – Ulrich Neumann Jan 10 '24 at 16:00
11

There is no better implementation than just to count raster points of colors.

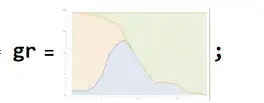
Paste your graphics into a variable

Pasted image

Get image raster data and delete possible alpha channel.

   gr1 = Map[(Take[#, 3] &), ImageData[ gr ], {2}];

Define a select function for RGB below a white treshhold (or distances to any other uniform background colors) for a whole row of the raster

   sel = (Select[#, ( Mean[Flatten[#]] < 0.98 &)] &);

and select colored rows and columns.

   gr2 = sel[ sel[gr1]\[Transpose]]\[Transpose];

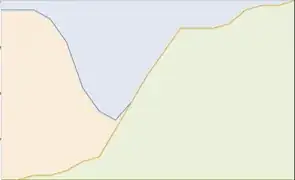
Optical check of cropped result

  Image[Raster[gr2]]    

Crop image

   total = Times @@ Dimensions[gr2][[1 ;; 2]];

Map count function into logic of the three predominant colors

 (PercentForm[
   N[Count[ gr2, {R_Real, G_, B_} /; #, {2}] / tot]] &) /@
       {R > G && R > B, (G > R && G > B), (B > R && B > G)}

{25.95%, 50.3%, 23.05%}

Roland F
  • 3,534
  • 1
  • 2
  • 10
  • Good estimation! I think in the last step of your code, tot should be total. Other than that, I wonder why the percent distribution is not totaling to 1. Will that make sense if I Normalize[**%distribution**, Total] because any image in its totality should be equal to 100%. The %distribution in the image given in the question is almost equal to 100%. But when I try it with different images, I get less than 100% distribution of the three colors. – Tugrul Temel Jan 10 '24 at 15:18
  • 1
    I roughly used < conditions only. In a discrete lattice, the partitions have to include <= cases, but with more than two colors , to count differently colored boundaries doesn't make much sense. Rests of white points on the outer edges are left out, too. The best way is to count the points over all three colors, or, more simple, divide by the sum of percentages to norm it to 100% – Roland F Jan 11 '24 at 17:09
  • Thanks for your clarification. – Tugrul Temel Jan 11 '24 at 17:33