The function is:
We know that f[x] is an even function defined on x < 0 And x > 0,
when x > 0,
0 < x <= 2, Abs[x-1],
x > 2, 1/2 f[x - 2]
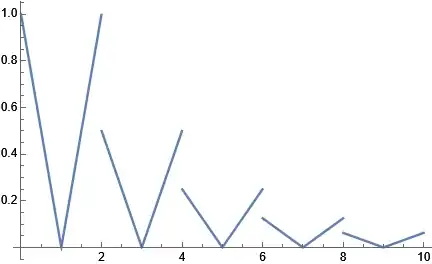
There is a problem with drawing an image of f[x] with the following code, see image drawing red circle
f[x_] :=
 Which[0 < x <= 2, Abs[x - 1], x > 2, 1/2 f[x - 2], x < 0, f[-x]]
Plot[f[x], {x, -1, 10}]

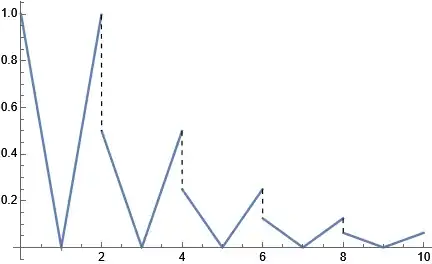
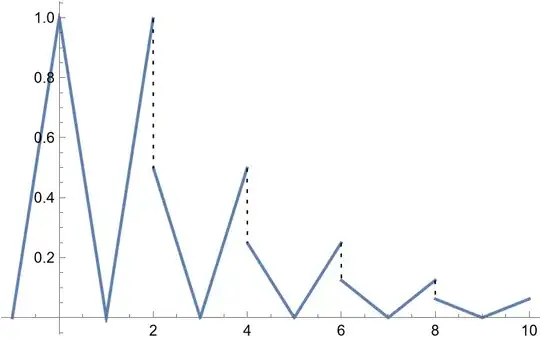
The correct image looks like this, and notice that the images at the demarcation point are not connected

How to make the segmentation function automatically draw the correct function image at the break point?