Through the above problem post solved the problem of software drawing solid line at the interval discontinuity point of the piecewise function.
f[x_] :=
 Which[0 < x < 2, Abs[x - 1], x > 2, 1/2   f[x - 2], x < 0, f[-x]]
Plot[f[x], {x, -1, 10}, Exclusions -> Range[2, 10, 2],
 ExclusionsStyle -> Dashed]

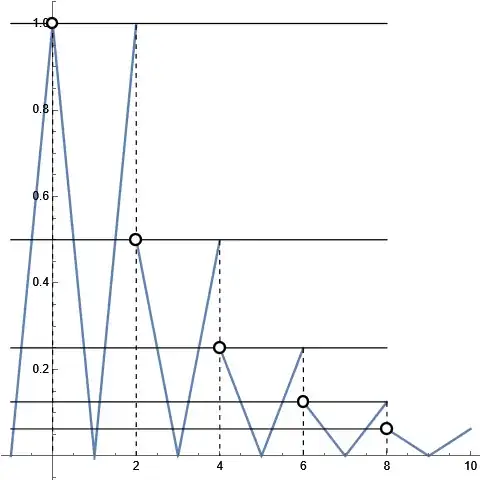
Now there is a problem, at the endpoint of the piecewise interval, a certain image includes the point corresponding to the interval endpoint, and a certain image does not include the point corresponding to the interval endpoint, which should be identified as a circle in the image. But the software automatically identifies it as a solid point that can be taken.
How can we set up the software to automatically draw a circle at the point of the corresponding function image that can not be taken?

According to the correct image, the position of the red circle in the top image, i.e. the point where the interval endpoint is not reachable, should be marked as a circle. How to set up so that the software can automatically mark as a circle at this point?