OP's original code:
$Assumptions = {r \[Element] Reals, r >= 0, rh \[Element] Reals,
   rh > 0, Q \[Element] Reals,
   Q >= 0, \[Alpha] \[Element] Reals, \[Alpha] > 0,
   P \[Element] Reals, P >= 0, L \[Element] Reals, L > 0};
M[rh_, Q_,
   P_] = (3 \[Pi] rh^2)/
     8 (1 + (2 \[Alpha])/rh^2 + (4 \[Pi] P rh^2)/
       3) + (\[Pi] Q^2)/(8 rh^2);
f[r_] = 1 +
   r^2/(4 \[Alpha]) (1 -
      Sqrt[1 + (64 \[Alpha] M[rh, Q,
            P])/(3 Pi r^4) - (8 \[Alpha] Q^2)/(3 r^6) - (32 Pi \
\[Alpha] P)/3]);
T[rh_, Q_,
   P_] = -((Q^2 - 3 rh^4 - 8 P \[Pi] rh^6)/(6 \[Pi] rh^5 +
       24 \[Pi] rh^3 \[Alpha]));
rhmin = SolveValues[T[rh, Q, P] == 0, rh, Reals][[1]];
Veff[r_] = f[r] (L^2/r^2 - [Epsilon]) // FullSimplify;
L = 20; P = 1/10; [Alpha] = 1/100; Q = 1/5; [Epsilon] = -1;
sol = SolveValues[Veff'[r] == 0, r, Reals][[3 ;; 5]];
Plot:
Plot[sol, {rh, 0, 1.6359193838319277`}]

ContourPlot:
style1 = Directive[Specularity[GrayLevel[1], 3], RGBColor[
0.368417, 0.506779, 0.709798],
Lighting -> {{"Ambient", RGBColor[
0.19699838300000003`, 0.252204821,
0.33320940200000004`]}, {"Directional", RGBColor[
0.15473514000000002`, 0.21284718000000002`,
0.29811516000000005`], ImageScaled[{0, 2, 2}]}, {"Directional",
RGBColor[
0.15473514000000002`, 0.21284718000000002`,
0.29811516000000005`], ImageScaled[{2, 2, 2}]}, {"Directional",
RGBColor[
0.15473514000000002`, 0.21284718000000002`,
0.29811516000000005`], ImageScaled[{2, 0, 2}]}}];
style2 = Directive[Specularity[GrayLevel[1], 3], RGBColor[
0.880722, 0.611041, 0.142051],
Lighting -> {{"Ambient", RGBColor[
0.30100577, 0.22414668499999998`, 0.090484535]}, {"Directional",
RGBColor[0.2642166, 0.18331229999999998`, 0.04261530000000001],
ImageScaled[{0, 2, 2}]}, {"Directional", RGBColor[
0.2642166, 0.18331229999999998`, 0.04261530000000001],
ImageScaled[{2, 2, 2}]}, {"Directional", RGBColor[
0.2642166, 0.18331229999999998`, 0.04261530000000001],
ImageScaled[{2, 0, 2}]}}];
style3 = Directive[Specularity[GrayLevel[1], 3], RGBColor[
0.560181, 0.691569, 0.194885],
Lighting -> {{"Ambient", RGBColor[
0.1830429875, 0.21424763749999998`,
0.0962851875]}, {"Directional", RGBColor[
0.14004525, 0.17289224999999997`, 0.048721249999999994`],
ImageScaled[{0, 2, 2}]}, {"Directional", RGBColor[
0.14004525, 0.17289224999999997`, 0.048721249999999994`],
ImageScaled[{2, 2, 2}]}, {"Directional", RGBColor[
0.14004525, 0.17289224999999997`, 0.048721249999999994`],
ImageScaled[{2, 0, 2}]}}];
pl1 = sol[[1, 1]];
pl2 = sol[[2, 1]];
pl3 = sol[[3, 1]];
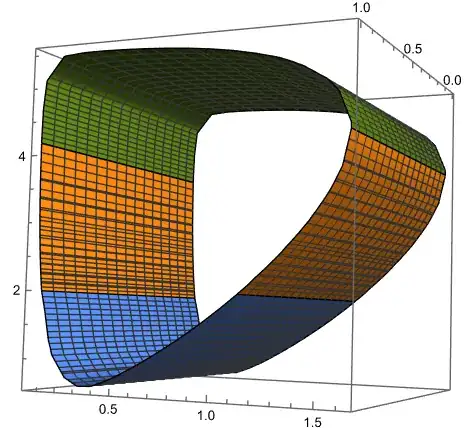
Show[ContourPlot3D[
r == pl1, {rh, 0.08352936846427979, 1.1186546369028976}, {r, rh,
6}, {z, 0, 1}, ContourStyle -> style1],
ContourPlot3D[
r == pl2, {rh, 1.1186546369028976, 1.6359193838319277}, {r, rh,
6}, {z, 0, 1}, ContourStyle -> style2],
ContourPlot3D[
r == pl2, {rh, 0.048454562655432167, 0.08352936846427979}, {r, rh,
6}, {z, 0, 1}, ContourStyle -> style2],
ContourPlot3D[
r == pl3, {rh, 0.048454562655432167, 1.6359193838319277}, {r, rh,
6}, {z, 0, 1}, ContourStyle -> style3], PlotRange -> All]
ContourPlot3D[
Veff'[r] == 0, {rh, 0.048454562655432167, 1.6359193838319277}, {r,
rh, 6}, {z, 0, 1}]


randrh. Though it works, aren't both results different? Since in the firstrdepends on therhinitials and in the second there is no such dependence. – codebpr Feb 22 '24 at 12:49{r, rhmin, 5}, {rh, rhmin, 1.63592}, {z, 0, 1}, I get a different result even when the range is the same. My ultimate aim is to project the extrema of theVeff[r]below it's 3D plot for different Black Holes as originally asked here. – codebpr Feb 22 '24 at 13:58f[r] (L^2/r^2 - \[Epsilon])and the extrema. – Ulrich Neumann Feb 22 '24 at 14:11Plot3D[f[r] (L^2/r^2 - \[Epsilon]), {rh, rhmin, 1.63592}, {r, rh, 6}, MeshFunctions -> Function[{r, rh}, fun[r, rh]], Mesh -> {{0}}, MeshStyle -> Red, PlotRange -> {0, 700}, AxesLabel -> {r, rh, "f[r] (L^2/r^2 - \[Epsilon])"}]I get the correct 3D plot but here the Mesh function which marks the extrema doesn't seem to work. – codebpr Feb 22 '24 at 14:21Plot3D...in my answer (rhmin==0.332372)? – Ulrich Neumann Feb 22 '24 at 15:13belt = ContourPlot3D[ fun[r, rh] == 0, {r, 0.5, 2}, {rh, 0, 1.2}, {z, -250, -300}]; Show[p, belt]`, I get this
– codebpr Feb 22 '24 at 15:43rbeforerh, while I userhfirst and thenrranges from{r, rh, 6}so they are both different data which can also be seen from theTableitself. – codebpr Feb 22 '24 at 16:36MeshFunctions -> Function[{rh, r}, fun[r, rh]]– Ulrich Neumann Feb 22 '24 at 17:21