6

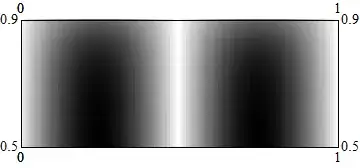
There seems to weird bug regarding non-integer PlotRange in ArrayPlot. For example...

ArrayPlot[
   Table[Sin[x/50 π] Tanh[y/50 π], {y, 100}, {x, 100}],
   DataRange -> {{0, 1}, {0, 1}},
   PlotRange -> {{0, 1}, {0.5, .9}}
]

gives an error:

Value of option PlotRange -> {{0,1},{0.5,0.9}} is not All, Full, Automatic, a positive machine number, or an appropriate list of range specifications.

The same code works, if one of the plot range parameters for y-axes is turned into an integer.

Did I do smth wrong? Is there a workaround?

I need to use array plot as ListContourPlot is too slow for large datasets and MatrixPlot has the same problem.

I am using Mathematica 8 64 bit version on linux.

Edit

After some more testing I see, that it works whenever PlotRange includes at least one integer. For example PlotRange -> {{0, 1}, {0.5, 1.2}} works as it includes 1. So one possible workaround is just to scale the range, such that max-min would be larger than 1.

But I am still looking forward, if anyone finds a way to have shorter than 1 range on the axes. Dirty way would be just using manual 'Ticks'.

Edit 2

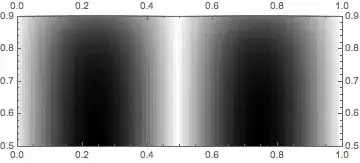
Possible workaround.

As I wrote in the previous edit, it works, then the range includes at least one integer. So one could just scale the range. Here is a naive hard-coded example how it might be done.

ArrayPlot[
   Table[Sin[x/50 π] Tanh[y/50 π], {y, 100}, {x, 100}],
   DataRange -> {{0, 1}, {0, 1} 10}, 
   PlotRange -> {{0, 1}, {0.1, 0.8} 10}, 
   FrameTicks -> {Table[{y, ToString[y/10 // N]}, {y, 1, 8, 1}], 
   Table[{x, ToString[x // N]}, {x, 0, 1, 0.25}]}, 
   AspectRatio -> 1
]

This means that I have bypassed the only side-effect of scaling the range, which is messing up the tick labels.

I would submit it as a solution, when I have waited my 8 hours and there is no nicer one proposed.

Mr.Wizard
  • 271,378
  • 34
  • 587
  • 1,371
Johu
  • 4,918
  • 16
  • 43
  • This is actually quite a good question as one would assume that when using a DataRange the PlotRange you used should be valid, but it's not. I notice that this question is tagged version-8 -- I have the same problem in version 7 so this is not specific to v8 only. – Mr.Wizard Aug 14 '13 at 14:47
  • I also tested in version 9. The problem does not seem to be version specific. I removed the tag. Thanks @Mr.Wizard – Johu Aug 14 '13 at 15:25

3 Answers3

4

All observations that follow were made using Mathematica 7.


The problem is that deep in the option processing of ArrayPlot, Floor and Ceiling are used on the numeric values in the PlotRange option value. This is evidenced by Blocking these function while calling ArrayPlot:

Block[{Floor = Identity, Ceiling = Identity},
 ArrayPlot[
  Table[Sin[x/50 π] Tanh[y/50 π], {y, 100}, {x, 100}],
  DataRange -> {{0, 1}, {0, 1}}, PlotRange -> {{0, 1}, {0.5, .9}},
  FrameTicks -> All
 ]
]

enter image description here

This actually works just fine here and we get the desired plot, but this fix is hardly "safe" as it's impossible to guess what other steps in the plot creation are altered by this.

I am continuing to dig through internal code but even if I find a fix for version 7 there is no guarantee that it will be easily ported to later versions.


In version 7 the two functions that need to be modified are:

  • Graphics`ArrayPlotDump`Private`ArrayTicks

  • Graphics`ArrayPlotDump`Private`getRange

Mr.Wizard
  • 271,378
  • 34
  • 587
  • 1,371
  • This is probably the same bug that affects DataRange in ArrayPlot... you get a First::first error if both extents of the limit have the same Floor value. Example: ArrayPlot[RandomReal[1, {10, 10}], DataRange -> {{0.2, 0.4}, {0, 1}}, FrameTicks -> True] – rm -rf Aug 14 '13 at 18:52
  • @rm-rf That one is caused by Private`ArrayTicks, yes. getRange is more significant in the case above because that's what ends up halting evaluation. – Mr.Wizard Aug 14 '13 at 19:11
3

From help

PlotRange -> {{ imin,imax }, {jmin ,jmax }} shows only elements 
with and in the specified ranges. The top-left element has , 
increases down the page; increases to the right. 

enter image description here So these are index values. You can't use .5 and .9 or even zero.

ArrayPlot[
 N@Table[Sin[x/50 π] Tanh[y/50 π], {y, 100}, {x, 100}], 
 PlotRange -> {{30, 50}, {30, 100}}]

Mathematica graphics

You said : The same code works, if one of the plot range parameters for y-axes is turned into an integer

Can you should the code you used for this? I am not following.

http://reference.wolfram.com/mathematica/ref/ArrayPlot.html

Michael E2
  • 235,386
  • 17
  • 334
  • 747
Nasser
  • 143,286
  • 11
  • 154
  • 359
  • ArrayPlot[Table[Sin[x/50 \[Pi]] Tanh[y/50 \[Pi]], {y, 100}, {x, 100}], DataRange -> {{0, 1}, {0, 1}}, PlotRange -> {{0, 1}, {0, 0.5}}] This seems to work funny enough. – Jonie Aug 14 '13 at 00:57
  • This all makes no sense. I think this is a bug. According to help, PlotRange is element index. It says right there with top left element has i=1,j=1. – Nasser Aug 14 '13 at 01:04
  • 1
    The text in help is valid only while you have not specified DataRange. It is not an index in this case.

    Example: ArrayPlot[Table[Sin[x/50 [Pi]] Tanh[y/50 [Pi]], {y, 100}, {x, 100}], DataRange -> {{10, 20}, {10, 20}}, PlotRange -> {{10, 20}, {0, 30}}]

    – Johu Aug 14 '13 at 01:05
  • You say The text in help is valid only while you have not specified DataRange Where did you read that? PlotRange has 4 different forms. If you use the form you showed, then it means an index. Period. The help is clear. I say this is a bug. But what do I know. – Nasser Aug 14 '13 at 01:12
  • I did not read that. I see how it acts when I use combination of other options. I also told it was a bug and asked for a workaround. – Johu Aug 14 '13 at 01:17
  • @Johu The workaround is to assume these are indices and use them as such. You showed a case where they worked when these are not indices (since an index can't be zero nor fraction), then I say this should not have worked and this looks like a bug to me. But please wait for others to look at this. This is what I know myself now from looking at help. – Nasser Aug 14 '13 at 01:42
  • @Nasser I agree with you now. Probably it was not meant to be used as did I. I did not get you before. – Johu Aug 14 '13 at 15:28
2

Here is a workaround that works in V7,8,9,10 (the underlying problem persists):

Show[
 ArrayPlot[
  Table[Sin[x/50 π] Tanh[y/50 π], {y, 100}, {x, 100}], 
  DataRange -> {{0, 1}, {0, 1}}],
 PlotRange -> {{0, 1}, {0.5, .9}}, FrameTicks -> All]

Mathematica graphics

Michael E2
  • 235,386
  • 17
  • 334
  • 747