I want to use ArrayPlot instead of a DensityPlot because it seems to be faster (more here)
I still want axes ticks to have real values and not array index.
I came up with following code which basically centers and scales ArrayPlot according to PlotRange given to Graphics:
arrayPlot[data_, opts___] :=
  Module[{dim = Dimensions[data] // N, rls, range, imgSz, aRatio,
    cf},
   rls = {opts}~
     Join~{PlotRange -> Transpose@{{1, 1}, dim},
      ImageSize -> {500, 300}, ColorFunction -> "Rainbow"};
   {range, cf} = {PlotRange, ColorFunction} /. rls;
   aRatio = 1/Divide @@ (ImageSize /. rls);
   Graphics[{Scale[#, (range.{-1, 1})*dim^-1] &@
          Translate[#, (range.{1, 1} - dim)*0.5] &@
        First@ArrayPlot[data, ColorFunction -> cf,
          DataReversed -> True]}, Frame -> True,
      AspectRatio -> aRatio, #] & @@ rls
   ];
It works OK and with:
dataP[m_, n_] := Table[i*Boole[j < i], {i, 1, m}, {j, 1, n}];
arrayPlot[dataP[100, 100], ImageSize -> {500, 500},
 ColorFunction -> "Rainbow", PlotRange -> {{-21, 23}, {-1, 1}}]
I get

If I modify a arrayPlot with GridLines -> Automatic , GridLinesStyle ->
Directive[Orange, Thickness[0.05]] added to Graphics, I get gridlines behind the plot.

How can I make the grid lines appear in front of the plot? It is possible to add Mesh to ArrayPlot, but I want to avoid it since it will require synchronization of mesh with axes ticks.
Edit
Considering answer by 'rm -rf' the updated function is:
arrayPlot[data_, opts___] :=
Module[{dim = Dimensions[data] // N, rls, range, imgSz, aRatio,
cf},
rls = {opts}~
Join~{PlotRange -> Transpose@{{1, 1}, dim},
ImageSize -> {500, 300}, ColorFunction -> "Rainbow",
Method -> {"GridLinesInFront" -> True}};
{range, cf} = {PlotRange, ColorFunction} /. rls;
aRatio = 1/Divide @@ (ImageSize /. rls);
rls = Select[rls,
MatchQ[#, Alternatives @@ (#[[1]] & /@ Options[Graphics]) -> _] &];
Graphics[{Scale[#, (range.{-1, 1})*dim^-1] &@
Translate[#, (range.{1, 1} - dim)*0.5] &@
First@ArrayPlot[data, ColorFunction -> cf,
DataReversed -> True]}, Frame -> True,
AspectRatio -> aRatio, ##] & @@ rls
];
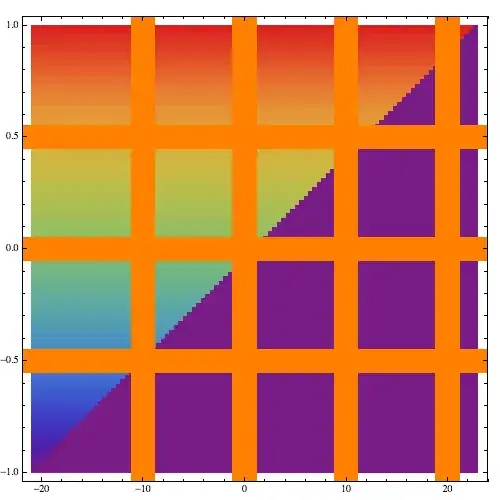
arrayPlot[dataP[100, 100], GridLines -> Automatic ,
ColorFunction -> "BlueGreenYellow",
GridLinesStyle -> Directive[Orange, Thickness[0.01]],
ImageSize -> {500, 500}, PlotRange -> {{-28, 23}, {-1, 1}}]
DataRangeoption? This produces your basic plot:Show[ ArrayPlot[dataP[100, 100], ImageSize -> {500, 500}, ColorFunction -> "Rainbow", DataReversed -> True, DataRange -> {{-21, 23}, {-1, 1}}], FrameTicks -> Automatic, AspectRatio -> 1]Grid lines can be added á la rm -rf's answer. – Michael E2 Jul 03 '13 at 22:56ArrayPlothas bugs. – Johu Jul 13 '14 at 16:55