I have a ContourPlot where I have let Mathematica draw the contours automatically. I would like to extract the zmax and zmin contour values that have been determined internally so that I can pass them to ShowLegend to be shown with the color-bar. I am using Mathematica 8.
Needs["PlotLegends`"]
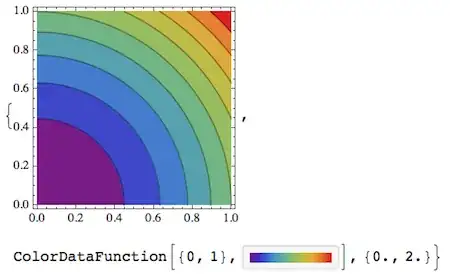
plTest = ContourPlot[xv^2 + yv^2, {xv, 0, 1}, {yv, 0, 1},
Contours -> 9, ColorFunction -> "Rainbow"];
ShowLegend[plTest, {ColorData["Rainbow"][1 - #1] &, 10, "max", "min",
LegendPosition -> {0.6, 0}, BaseStyle -> {FontSize -> 14}}]
I would like the actual zmax and zmin values to appear in the colorbar in the legend instead of the "max" and "min" above. Can someone please help me with this?
There is a similar post: ShowLegend values , but I can't get this to work with ContourPlot type. Thanks.


plTest=ContourPlot[...]; reportColorRange[plTest]it does NOT work! However, if I doreportColorRange[ContourPlot[...]]it DOES work. I am puzzled... – Shrihari Aug 14 '13 at 18:33reportColorRangehas to look over Mathematica's shoulder while it's calculating the plot. So you have to always wrap the actual plot command byreportColorRange. When the plot is already done, it's too late to find out all the function values that have actually been encountered (to get the accurate max and min) - because only the function values at which contours are drawn will actually be kept, and that's not the correct min-max range. – Jens Aug 14 '13 at 18:37