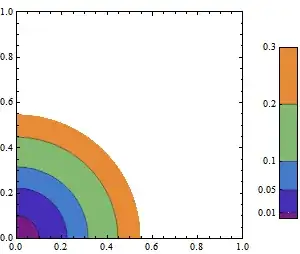
I have a ContourPlot in which I have specified the contour-values myself as Contours->{0.01, 0.05, 0.1, 0.2, 0.3}. I would like to get the corresponding contour-values to be shown in the color-bar in the Legend. How do I do this?
To get the max and min values, I am using the code in the following post which defines the reportColorRange[...] function: ShowLegend values .
Part of my question is answered by another post:
How can I label a ListDensityPlot with a color bar? ,
but probably this only works for a linear spacing of contours?
An example code is below.
Needs["PlotLegends`"]
{plTest, colors, range} = reportColorRange[
  ContourPlot[xv^2 + yv^2, {xv, 0, 1}, {yv, 0, 1},
    Contours -> {0.01, 0.05, 0.1, 0.2, 0.3}, ColorFunction -> "Rainbow"]];
LMin = range[[1]];  LMax = range[[2]];
ShowLegend[plTest, {ColorData["Rainbow"][1 - #1] &, 6,
  ToString[Round[LMax, 0.01]], ToString[Round[LMin, 0.01]],
  LegendPosition -> {0.6, 0}, BaseStyle -> {FontSize -> 14}}]
I would like the 5 contour-values to appear in the Legend next to the "ticks" which are blank right now. I have left the max and min values shown right now, but I don't necessarily need them. It's sufficient (and probably better) to show only the contour values.
Thanks.
PS: This is also related to another post of mine: Mathematica 8: ContourPlot finding out max and min function values Sorry for the multiple posts, but I am still converging on what appearance I want for the plot and legend.