7

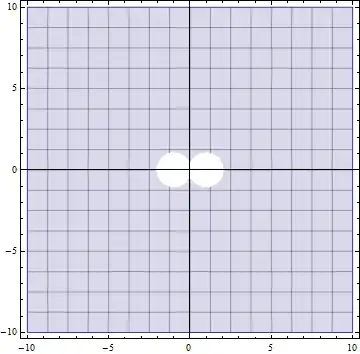
I'm working on a complex question that asks that I determine a function that maps the complement of the region $D=\{z:|z+1|\le 1\}\cup\{z: |z-1|\le 1\}$ onto the upper half plane. That is, $f$ must map the region $C\backslash D$ onto the upper half plane. Here is my proposed answer: $$f(z)=e^{\pi(z+2)(-1+i)/(2z(1+i))}$$

And my code for the function and the region $C\backslash D$:

f = Function[z, Exp[Pi/2*(z + 2)*(-1 + I)/(z*(1 + I))]]
RegionPlot[(x + 1)^2 + y^2 > 1 && (x - 1)^2 + y^2 > 1, {x, -3, 
  3}, {y, -3, 3}]

If someone has a little time, could you maybe provide an easy way of shading the image of region $C\backslash D$ under the function $f$?

J. M.'s missing motivation
  • 124,525
  • 11
  • 401
  • 574
David
  • 14,883
  • 4
  • 44
  • 117
  • 1
    http://mathematica.stackexchange.com/questions/20634/image-of-first-quadrant-under-fz-zi-z-i together with appropriate RegionFunction – ssch Aug 18 '13 at 21:32
  • 7
    You've got more than 30 answers to 21 questions, accepted 2, upvoted 2. Did really only 2 answers deserve upvotes? Why should one take his (little) time trying to help and provide nice answers to your questions? – Artes Aug 18 '13 at 21:46
  • @Artes - Worse than even me! Though, I have improved. – Mark McClure Aug 18 '13 at 22:29
  • 2
    @MarkMcClure I don't think that SE reputation is a major advantage of spending one's time here of course, but rather gaining knowledge from others. Having said that, I expect one should acknowledge other's time and effort when getting help. – Artes Aug 18 '13 at 22:56
  • @Artes Yes! I improved my voting behavior after being prodded by you. Thanks! (Not that it's outstanding or anything but, certainly, an improvement.) – Mark McClure Aug 18 '13 at 22:59
  • @MarkMcClure while your voting is not stellar, you've answered 176 questions. I think we'll make an exception, just this once. :) – rcollyer Aug 21 '13 at 18:59

2 Answers2

11
ParametricPlot[
 Evaluate@(Through[{Re, Im}[
      x + I y]] Boole[((x + 1)^2 + y^2 > 1 && (x - 1)^2 + y^2 > 
        1)]), {x, -3, 3}, {y, -3, 3}, PlotRange -> All]

is your domain

enter image description here

Your mapping:

f = Function[{x, y}, 
  Exp[Pi/2*(x + I y + 2)*(-1 + I)/((x + I y)*(1 + I))]];

maps into upper half plane:

ParametricPlot[
 Evaluate@(Through[{Re, Im}[
      f[x, y]]] Boole[((x + 1)^2 + y^2 > 1 && (x - 1)^2 + y^2 > 
        1)]), {x, -3, 3}, {y, -3, 3}]

enter image description here

ubpdqn
  • 60,617
  • 3
  • 59
  • 148
  • RegionFunction is a better approach than using Boole. This uses RegionFunction->Function[{x,y,u,v},(u-1)^2+v^2>1&&(u+1)^2+v^2>1]. This seems to work more quickly and efficiently. Boole was a quickk rushed answer. I am currently in very southerly latitude and only rarely online. – ubpdqn Aug 22 '13 at 23:01
9

Not to steal ubpdqn's thunder (he has an upvote from me), I prefer to make a dedicated function for this.

Clear[ComplexPlot]
SetAttributes[ComplexPlot, HoldAll];

ComplexPlot[f_, {z_Symbol, zmin_?NumericQ, zmax_?NumericQ}, 
   opts:OptionsPattern[ParametricPlot]]:=
Block[{z, u, v, ulims, vlims},
    ulims = {Min[#], Max[#]}& @ {Re[zmin], Re[zmax]};
    vlims = {Min[#], Max[#]}& @ {Im[zmin], Im[zmax]};
    With[{z = u + I v, u = {u, ##}& @@ ulims, v = {v, ##}& @@ vlims},
        ParametricPlot[{Re[f], Im[f]}, u, v, opts]
    ]
]

This simplifies things considerably. For instance, here is a slight modification of an example in the documentation:

ComplexPlot[z + 1/z, {z, -1/2 - 1/2 I, 1/2 + 1/2 I}, PlotRange -> 5, 
   MeshStyle -> {Orange, Green}]

enter image description here

Note: it uses the real and imaginary parts of the limits to generate the limits to plot over. There is no checking, at the moment, to determine if this actually generates a rectangle in the complex plane, or not.

rcollyer
  • 33,976
  • 7
  • 92
  • 191
  • Shouldn't vlims be the imaginary part? As it stands ulims==vlims. Can this function be used to map arbitrary domains, e.g. Abs[z]<1, or just rectangular domains? (+1) – C. E. Aug 21 '13 at 20:02
  • Thanks for pointing out the typo. Arbitrary domains require a bit more work, so let me think on it. Of course, the real method is to use domainPlot by Simon Woods. – rcollyer Aug 21 '13 at 20:10