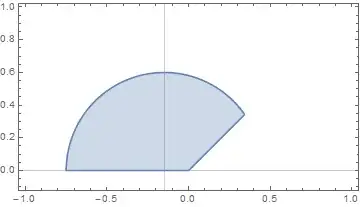
I need to plot the function where z is a complex number:
$$S = {z:|z + 0.15|<0.6} \wedge {z:Pi/4<=arg(z)<=Pi}$$
I can do this:
RegionPlot[{Norm[x + y + 1.5] < 0.6}, {x, -4, 4}, {y, -4, 4}]
But it does not bound it by {z:Pi/4<=arg(z)<=Pi}
Any help would be appreciated.